Fig. 8.
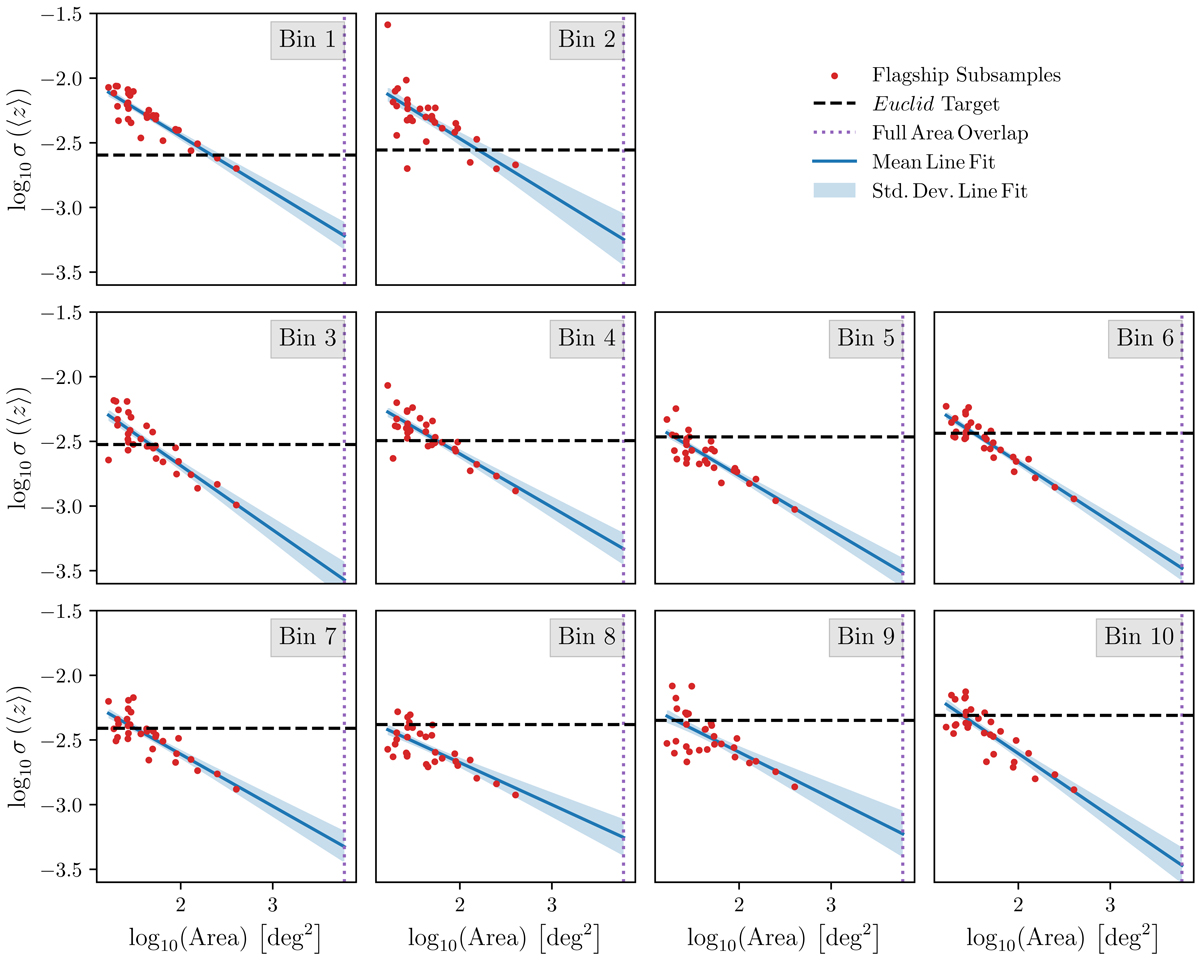
Download original image
Uncertainty on the mean redshift for each Euclid tomographic redshift bin shown as a function of tracer–target overlap area. The red points show the uncertainty on the mean redshift for each subregion, determined by fitting the shifted-true model (Sect. 3.3.1) to measured clustering redshifts (bias correction method 2, Sect. 3.1), with the largest area points representing constraints from the full 402 deg2 Flagship footprint. These points are used to fit a power-law relationship between overlap area and mean redshift uncertainty, shown in blue (the line represents the mean fit and the envelope the uncertainty). Extrapolated to the full area overlap of BOSS, DESI, and Euclid (the dotted purple line), the projected uncertainties on the mean are shown to be much smaller than the required uncertainties for Euclid, itself indicated by the dashed black line.
Current usage metrics show cumulative count of Article Views (full-text article views including HTML views, PDF and ePub downloads, according to the available data) and Abstracts Views on Vision4Press platform.
Data correspond to usage on the plateform after 2015. The current usage metrics is available 48-96 hours after online publication and is updated daily on week days.
Initial download of the metrics may take a while.