Fig. 5.
Download original image
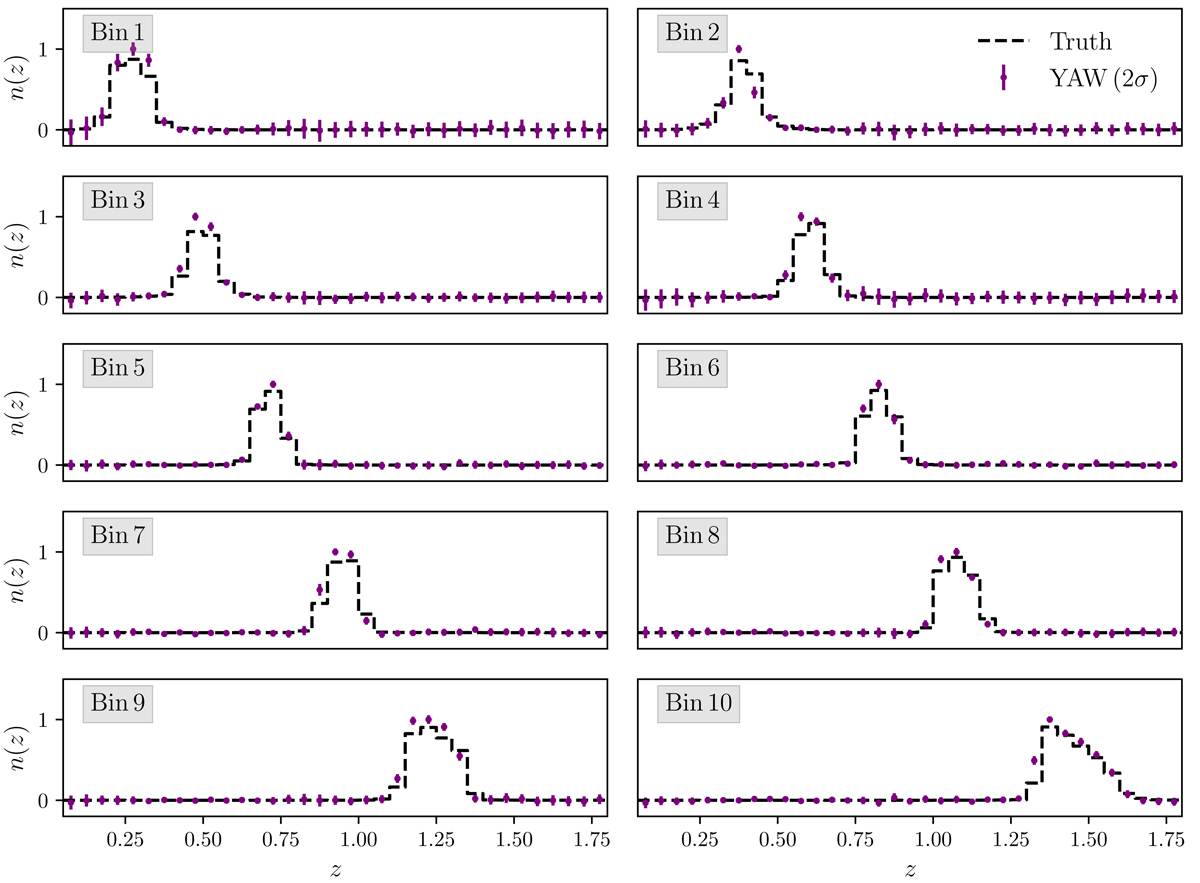
Clustering redshift measurements in comparison to the true n(z) for ten simulated Euclid Flagship tomographic photo-z bins. Measurements from YAW are shown in purple, with error bars indicating 95.5% confidence intervals. The measurements clearly trace the true n(z), albeit with some spurious local fluctuations. These fluctuations probably arise due to an incomplete galaxy bias correction methodology. The bias correction method used in this figure is method 2 (Sect. 3.1).
Current usage metrics show cumulative count of Article Views (full-text article views including HTML views, PDF and ePub downloads, according to the available data) and Abstracts Views on Vision4Press platform.
Data correspond to usage on the plateform after 2015. The current usage metrics is available 48-96 hours after online publication and is updated daily on week days.
Initial download of the metrics may take a while.