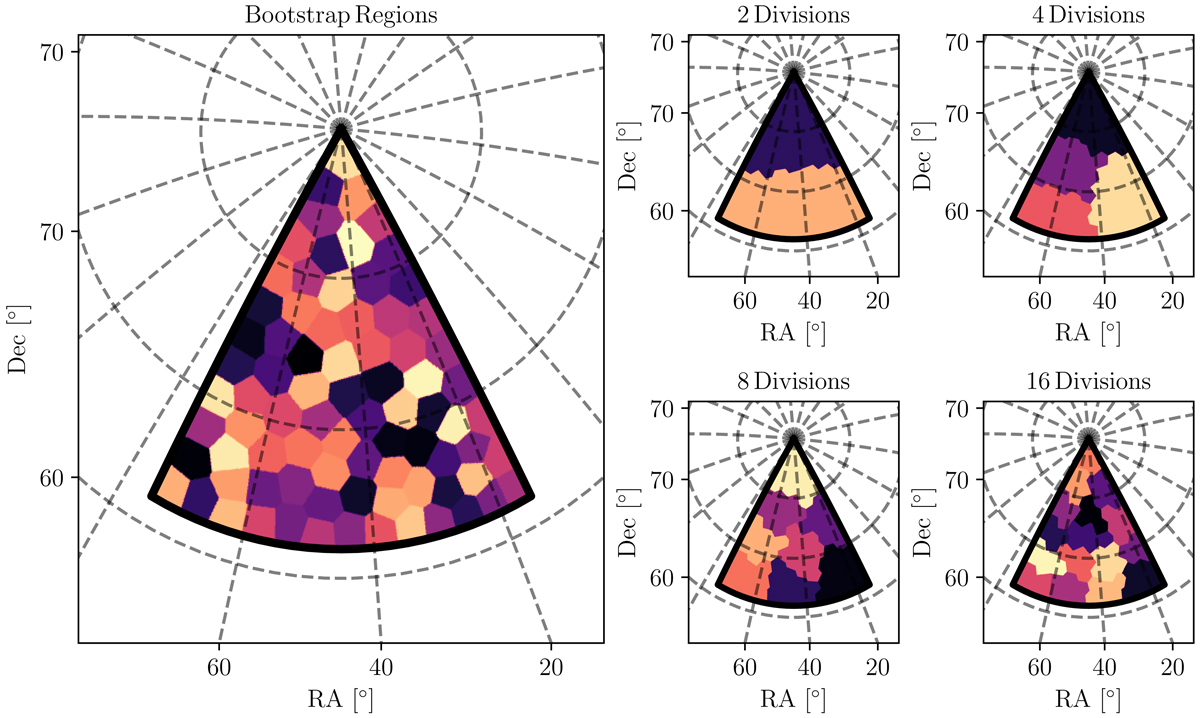
Fig. 4.
Download original image
Flagship footprint and area rescaling subregions. Left: bootstrap subregions, indicated with different colours, that are used to calculate errors in YAW. Right: different subregions of the Flagship footprint, shown with different colours, used to establish the relation between the tracer–target overlap area and the uncertainty on the mean redshifts of tomographic bins. The four subpanels show the Flagship footprint divided into 2 (top left), 4 (top right), 8 (bottom left), and 16 (bottom right) subregions. These are plotted on an orthographic projection of a subset of the sky focused on the Flagship footprint. The RA and Dec grid is shown with dashed grey lines. The values of the grid lines are indicated where they intercept the x-axis for the RA grid and the y-axis for the Dec grid.
Current usage metrics show cumulative count of Article Views (full-text article views including HTML views, PDF and ePub downloads, according to the available data) and Abstracts Views on Vision4Press platform.
Data correspond to usage on the plateform after 2015. The current usage metrics is available 48-96 hours after online publication and is updated daily on week days.
Initial download of the metrics may take a while.