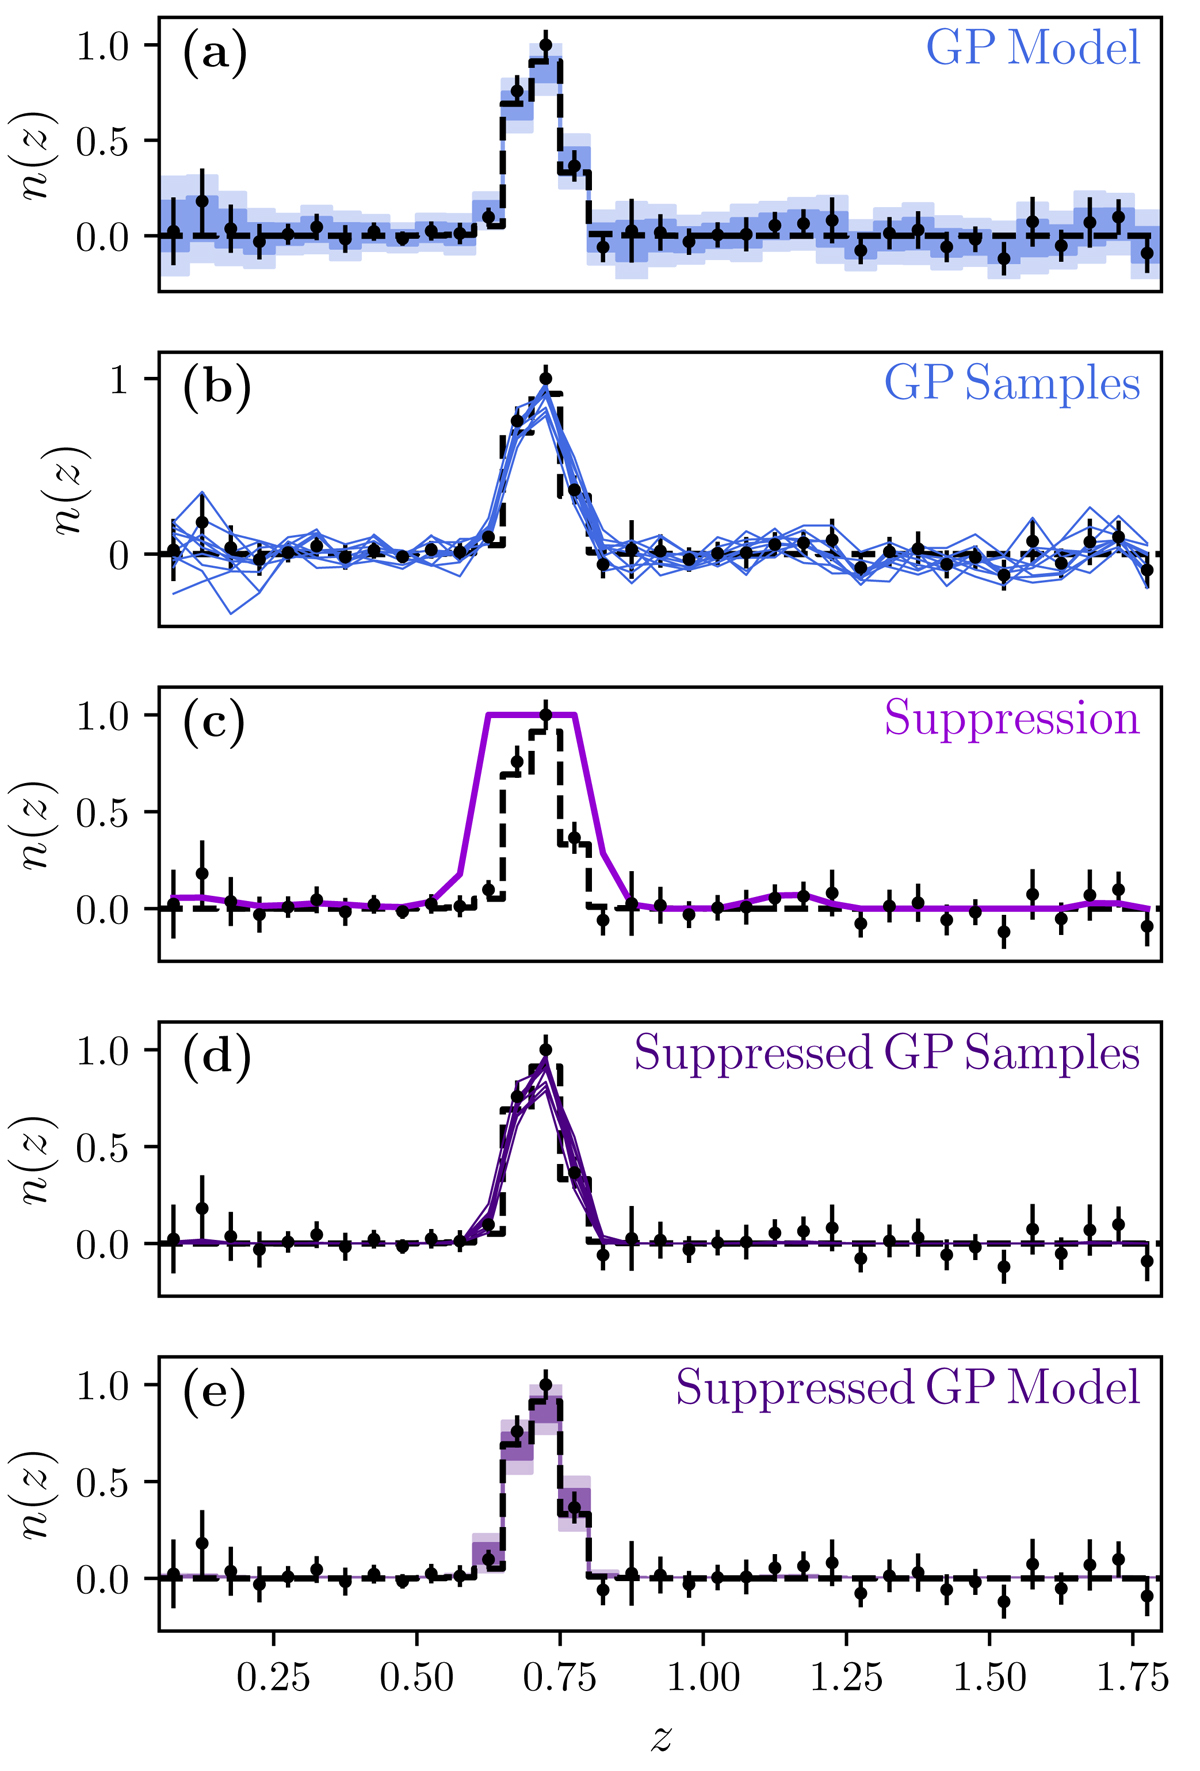
Fig. 3.
Download original image
Method for fitting suppressed-GP models to clustering redshift, n(z), measurements. The true n(z) for one tomographic bin is shown with dashed black lines. The measured clustering redshift, n(z), is shown with black markers and error bars. (a) We fit a GP model to the clustering redshift, n(z), measurements. (b) We draw random realisations from the GP. (c) We construct a suppression function, taking as input the GP draw and the smoothed S/N of the clustering redshift measurement. (d) We multiply the random realisations from the GP by the suppression function. This ensures that the suppressed-GP model is always positive and suppresses low-S/N fluctuations in the GP. (e) We construct 68.3% and 95.5% confidence envelopes from samples of the suppressed-GP model.
Current usage metrics show cumulative count of Article Views (full-text article views including HTML views, PDF and ePub downloads, according to the available data) and Abstracts Views on Vision4Press platform.
Data correspond to usage on the plateform after 2015. The current usage metrics is available 48-96 hours after online publication and is updated daily on week days.
Initial download of the metrics may take a while.