Fig. 2.
Download original image
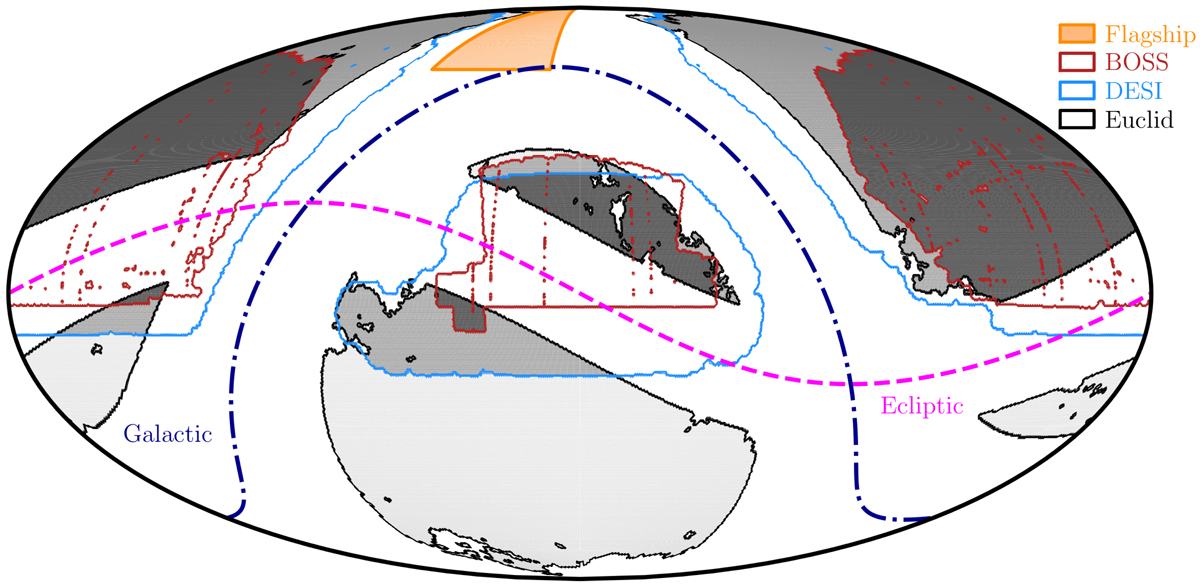
Survey footprints for BOSS, DESI, and Euclid shown on the sky, with darker greys indicating regions of tracer–target sample overlap. The footprint perimeter for BOSS is indicated in red, for DESI in blue, and for Euclid in black. Light grey indicates regions of the Euclid survey alone, mid-grey indicates regions with Euclid overlapping with either BOSS or DESI, and dark grey indicates regions with Euclid overlapping both BOSS and DESI. For comparison, the on-sky subregion of the Flagship octant for which we have simulated photo-z is shown in orange. The Euclid survey region is defined to avoid both the Ecliptic (dashed pink line) and Galactic (dash-dotted blue line) planes.
Current usage metrics show cumulative count of Article Views (full-text article views including HTML views, PDF and ePub downloads, according to the available data) and Abstracts Views on Vision4Press platform.
Data correspond to usage on the plateform after 2015. The current usage metrics is available 48-96 hours after online publication and is updated daily on week days.
Initial download of the metrics may take a while.