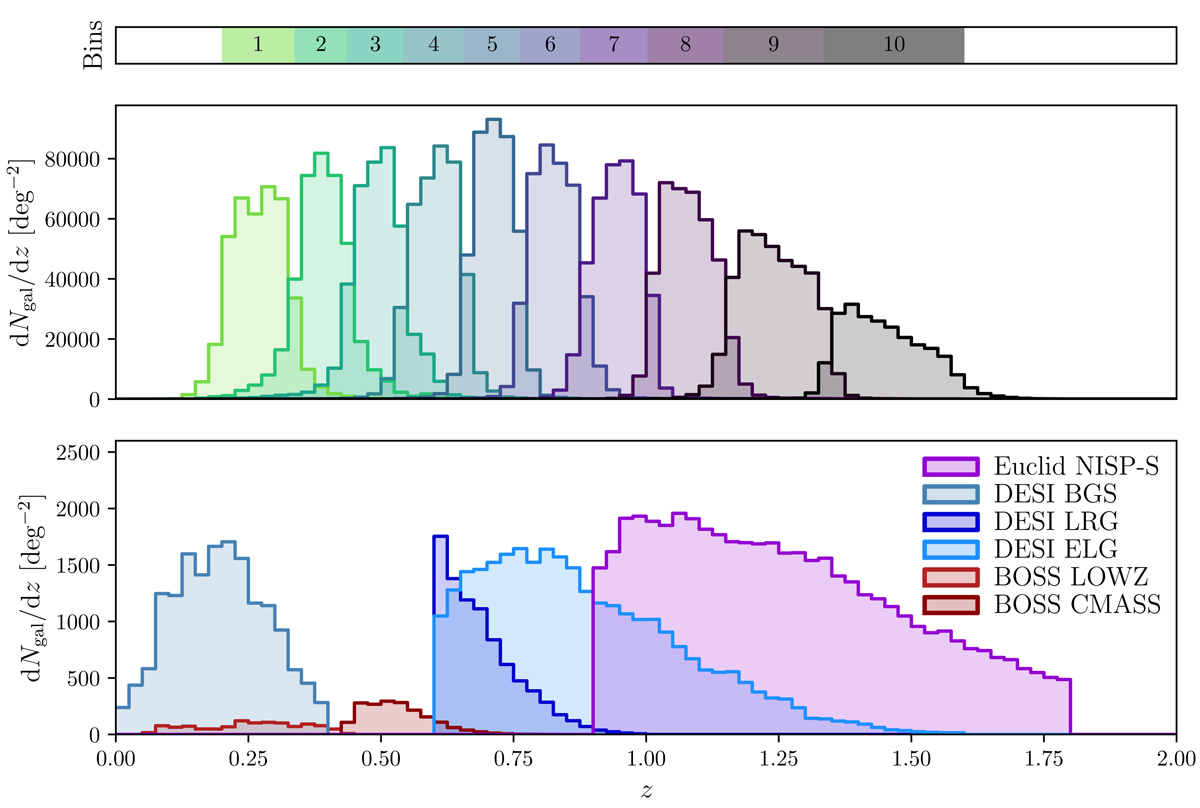
Fig. 1.
Download original image
Photometric redshift distribution in comparison to reference spectroscopic samples. Top: redshift ranges for each of the ten tomographic bins. Middle: true redshift distribution of each tomographic bin. Bottom: redshift distribution of the reference spectroscopic samples: BOSS-like LOWZ and CMASS; DESI-like BGS, LRG, and ELG; and Euclid NISP-S. The reference samples only support redshifts up to 1.8, and dictate the maximum redshift of bin 10.
Current usage metrics show cumulative count of Article Views (full-text article views including HTML views, PDF and ePub downloads, according to the available data) and Abstracts Views on Vision4Press platform.
Data correspond to usage on the plateform after 2015. The current usage metrics is available 48-96 hours after online publication and is updated daily on week days.
Initial download of the metrics may take a while.