Fig. 7
Download original image
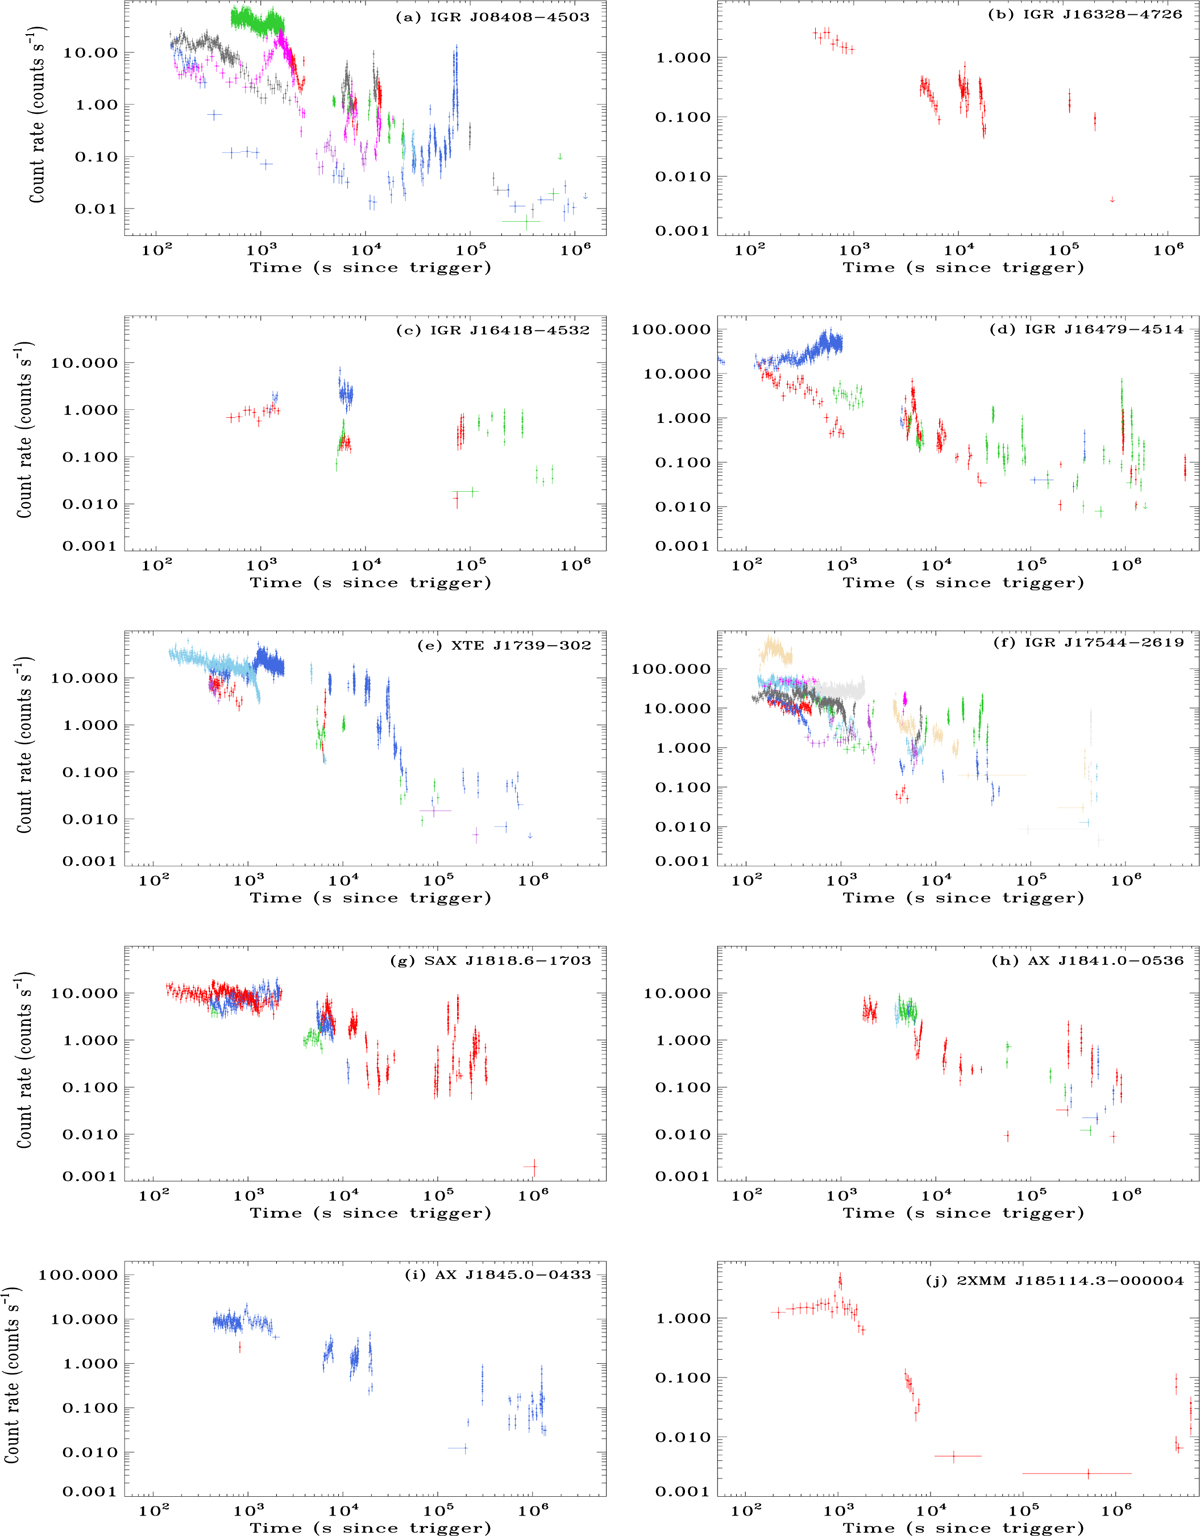
XRT light curves (counts s−1) in the 0.3–10 keV energy band grouped by source [(a) IGR J08408−4503, (b) IGR J16328−4726, (c) IGR J16418−4532, (d) IGR J16479−4514, (e) XTE J1739−302, (f) IGR J17544−2619, (g) SAX J1818.6−1703, (h) AX J1841.0−0536, (i) AX J1845.0−0433, (j) 2XMM J185114.3−000004] as a function of time (s) since the BAT trigger, where different colours correspond to different events. The complete list of triggers for each source can be found in Table 2.
Current usage metrics show cumulative count of Article Views (full-text article views including HTML views, PDF and ePub downloads, according to the available data) and Abstracts Views on Vision4Press platform.
Data correspond to usage on the plateform after 2015. The current usage metrics is available 48-96 hours after online publication and is updated daily on week days.
Initial download of the metrics may take a while.