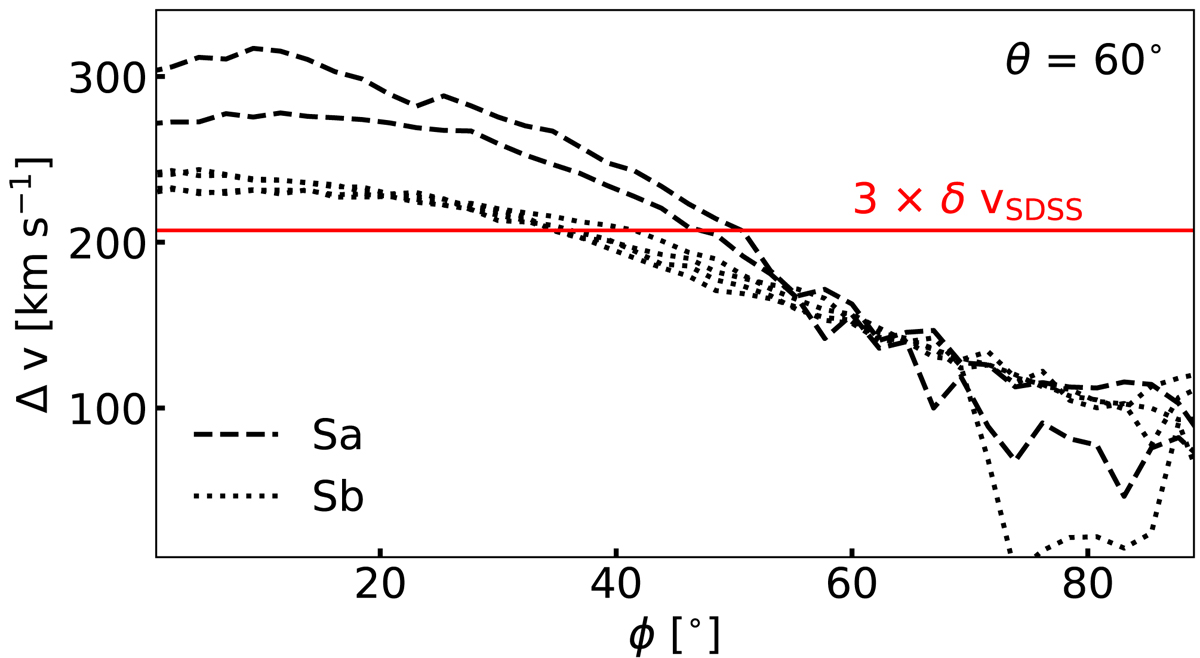
Fig. 9.
Download original image
Δv values from a double-Gaussian fit at different azimuth angles ϕ. We define ϕ as the azimuth angle with respect to the bar as visualised in Fig. 7. We computed spectroscopic observations at a fixed inclination of θ = 60° and at a redshift of z = 0.05. We show all snapshots of gSa and gSb simulations, which indicate a bar. With a red line we show the value of three times the bin-width of the SDSS. A Δv larger than this value is one criteria for a DP detection (see Sect. 2.3).
Current usage metrics show cumulative count of Article Views (full-text article views including HTML views, PDF and ePub downloads, according to the available data) and Abstracts Views on Vision4Press platform.
Data correspond to usage on the plateform after 2015. The current usage metrics is available 48-96 hours after online publication and is updated daily on week days.
Initial download of the metrics may take a while.