Fig. 7.
Download original image
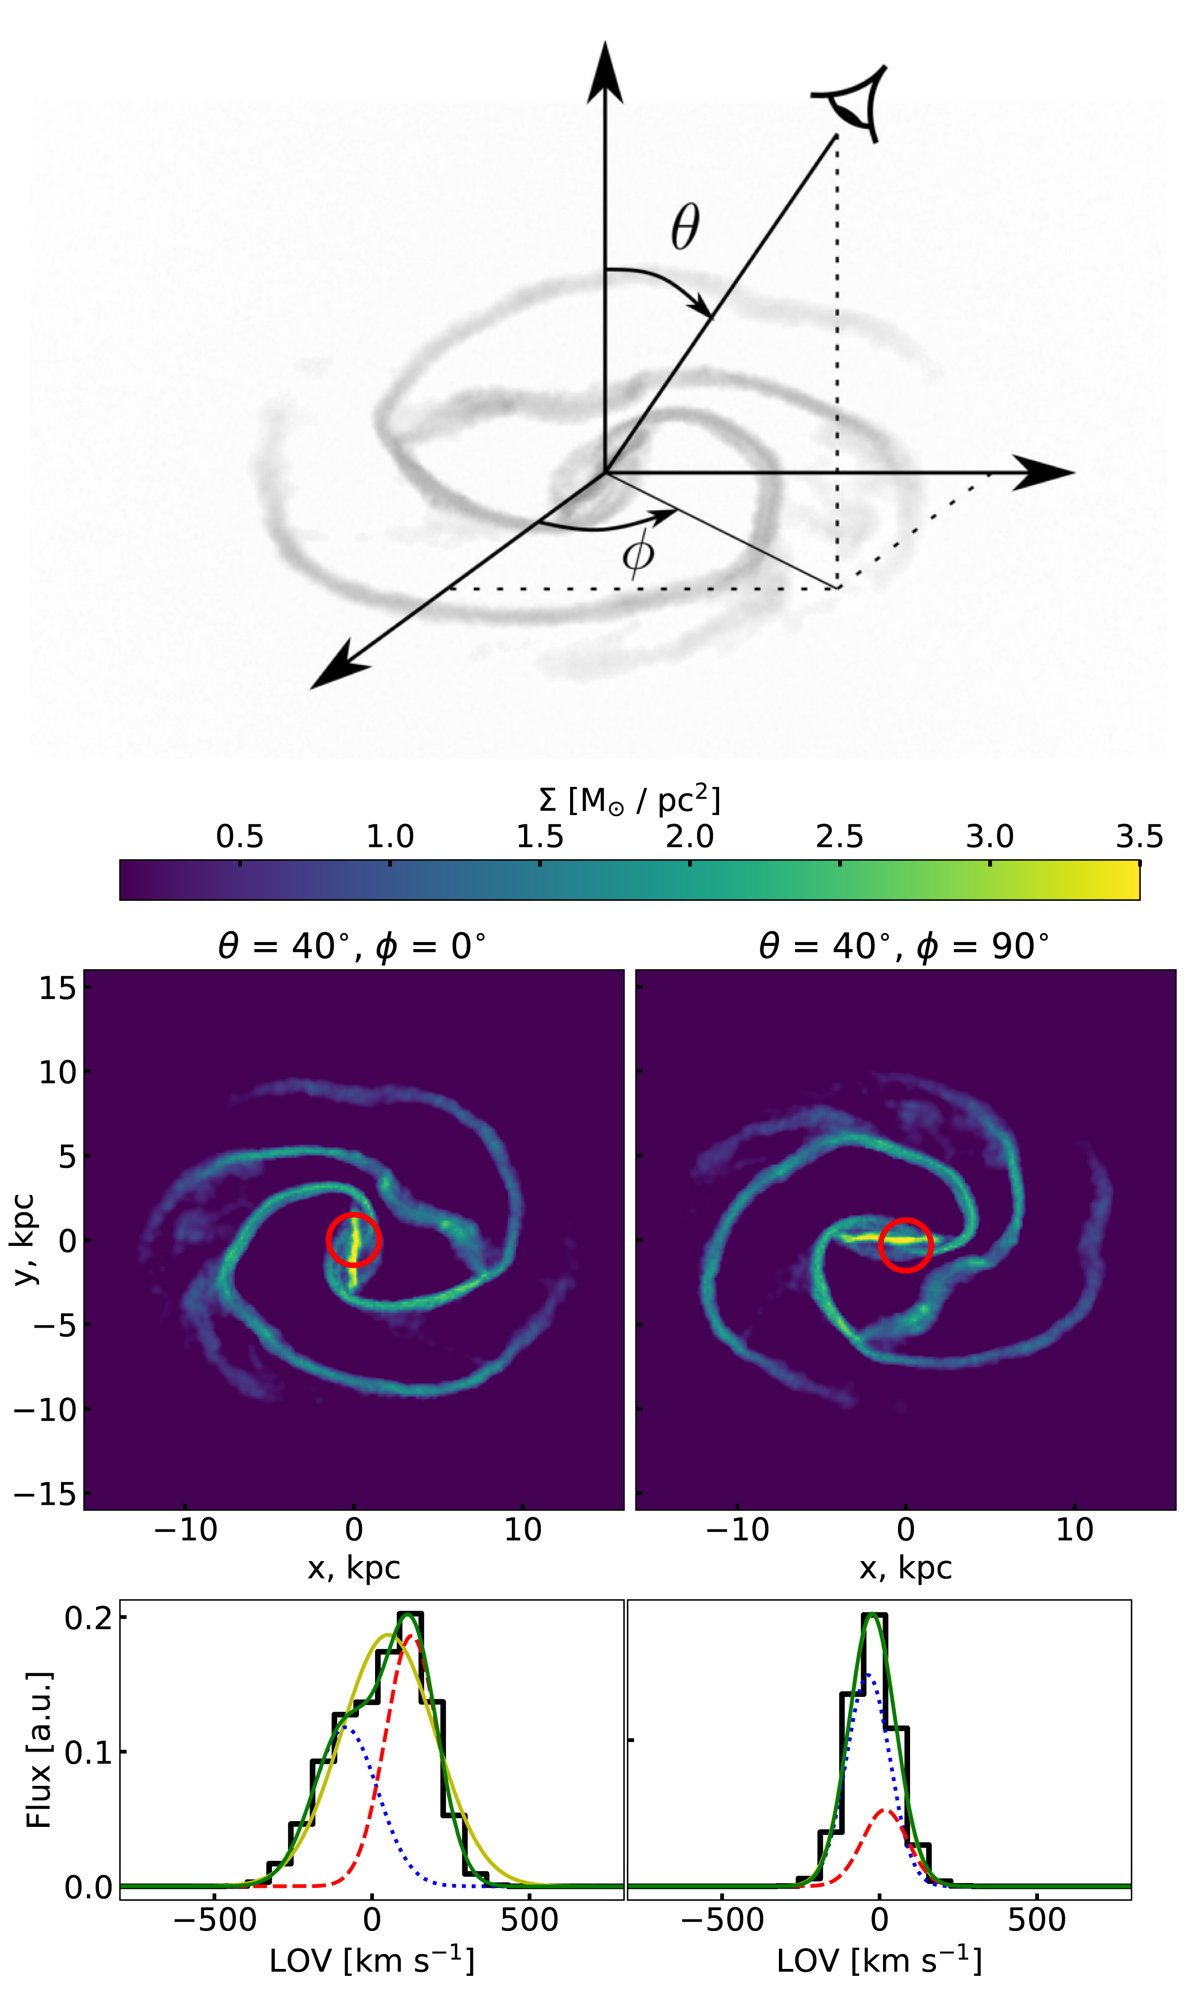
Observation of an isolated barred galaxy. On the top panel, we show the gas distribution in the 3D space and define the definition of the observation angles ϕ and θ. On the middle panel, two 2D projections are shown for an inclination of θ = 40°. On the left (resp. right ) we show an azimuth of ϕ = 0° (resp. ϕ = 90°) which corresponds to an observation parallel (resp. perpendicular) to the bar. With red circles, we mark a 3″ spectral fibre observation situated at a redshift of z = 0.05. On the bottom panels, we show the gas emission line line-of-sight distribution inside the fibre. We fitted a double and single Gaussian function to the emission lines.
Current usage metrics show cumulative count of Article Views (full-text article views including HTML views, PDF and ePub downloads, according to the available data) and Abstracts Views on Vision4Press platform.
Data correspond to usage on the plateform after 2015. The current usage metrics is available 48-96 hours after online publication and is updated daily on week days.
Initial download of the metrics may take a while.