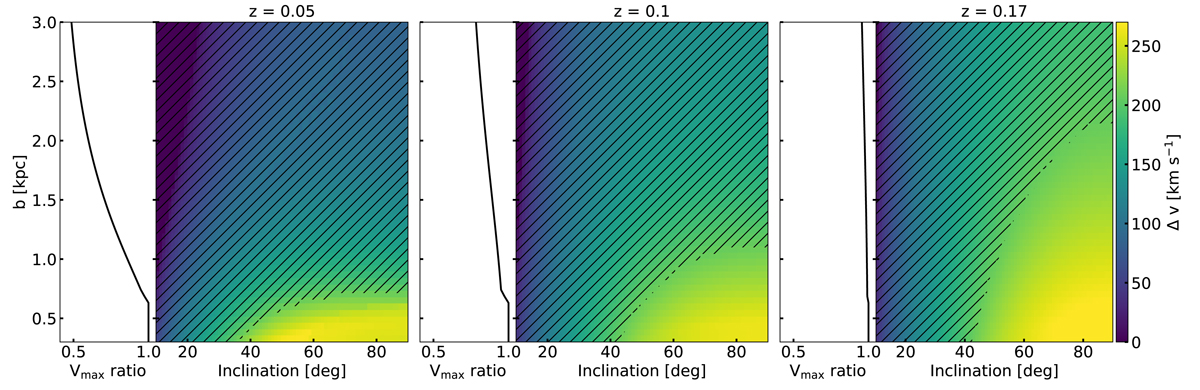
Fig. 5.
Download original image
Scans of DP detections for different inclinations and bulge concentrations of a modelled galaxy. Following Eq. (6), we computed the line-of-sight velocity profile as a function of inclination and the characteristic radius of the bulge b. We perform the DP selection procedure described in Sect. 2.3. We show from left to right the results for a redshift z = 0.05, z = 0.1, and z = 0.17, respectively. In each of the three panels, we show the Δv resulting from the double-Gaussian fit with the colour coding. We mark the parameter combinations where we do not detect a DP profile with black hatches. On the left side of each panel, we show the ratio between the maximal velocity value inside the spectroscopic fibre and the maximal velocity found in the entire rotation curve.
Current usage metrics show cumulative count of Article Views (full-text article views including HTML views, PDF and ePub downloads, according to the available data) and Abstracts Views on Vision4Press platform.
Data correspond to usage on the plateform after 2015. The current usage metrics is available 48-96 hours after online publication and is updated daily on week days.
Initial download of the metrics may take a while.