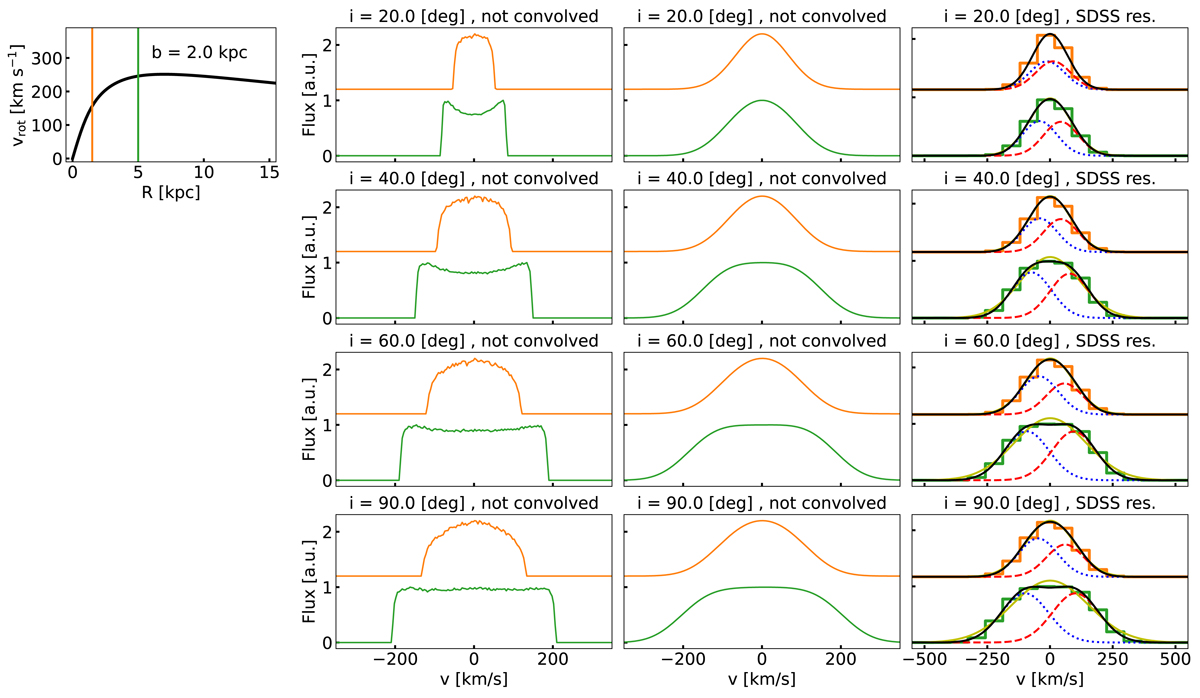
Fig. 4.
Download original image
Emission-line profiles of gaseous-disc model observed at different inclinations. On the top left, we show a rotation curve calculated by a model including a stellar and gaseous disc, a stellar bulge, and a dark-matter halo, parametrised as summarised in Table 1 with b = 2.0 kpc. We compute the emission-line profiles observed within a 3″ spectroscopic fibre for two redshift values: z = 0.05 and z = 0.17. The region probed by these observations are marked by orange and green line, respectively. For the emission-line profiles we also show the two spectroscopic observations in green and orange, with an off-set to the observation of z = 0.05 (orange spectra) to show them above the observation of z = 0.17 (green spectra). In the second column from the left, we show the measured line of sight velocity as described by Eq. (6). In the third column from the left, we show the observed spectra convolved by the SDSS mean instrumental broadening of 61 km s−1. On the rightmost column, we show this signal binned to the detector resolution of the SDSS with a bin-width of 69 km s−1. We fitted a single and a double-Gaussian function to the observations presented by yellow and black lines, respectively. For the double-Gaussian function we show its blueshifted (resp. redshifted) component by dotted blue (resp. dashed red) lines. The different rows show different values of inclination as indicated in the titles.
Current usage metrics show cumulative count of Article Views (full-text article views including HTML views, PDF and ePub downloads, according to the available data) and Abstracts Views on Vision4Press platform.
Data correspond to usage on the plateform after 2015. The current usage metrics is available 48-96 hours after online publication and is updated daily on week days.
Initial download of the metrics may take a while.