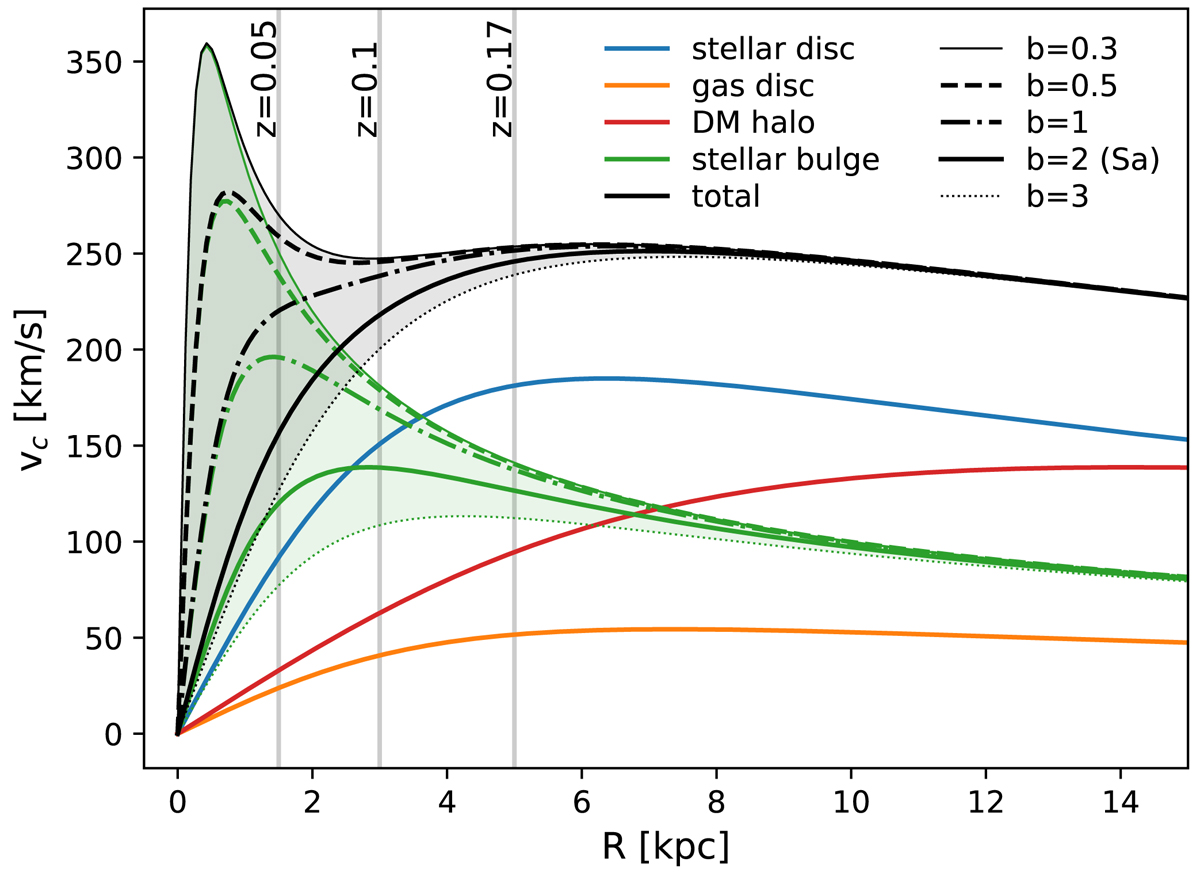
Fig. 2.
Download original image
Rotation curves of a disc galaxy for different characteristic radii of the stellar bulge. We show with coloured lines the contribution of each component, and in black the total rotation curve. In blue (resp. orange), we show the contributions of the stellar (resp. gaseous) disc, described by Miyamoto–Nagai density profiles. With a green (resp. red) line, we show the contributions of the stellar bulge (resp. dark-matter halo), described by Plummer density profiles. We show with different line styles the contribution of the bulge and the total rotation curve for bulges with different characteristic radii b. A characteristic bulge radius b = 2 (thick solid green and black lines) corresponds to the fiducial Sa galaxy. Vertical grey lines are plotted at the radii of the simulated fibre for the redshifts z = 0.05, 0.1, and 0.17.
Current usage metrics show cumulative count of Article Views (full-text article views including HTML views, PDF and ePub downloads, according to the available data) and Abstracts Views on Vision4Press platform.
Data correspond to usage on the plateform after 2015. The current usage metrics is available 48-96 hours after online publication and is updated daily on week days.
Initial download of the metrics may take a while.