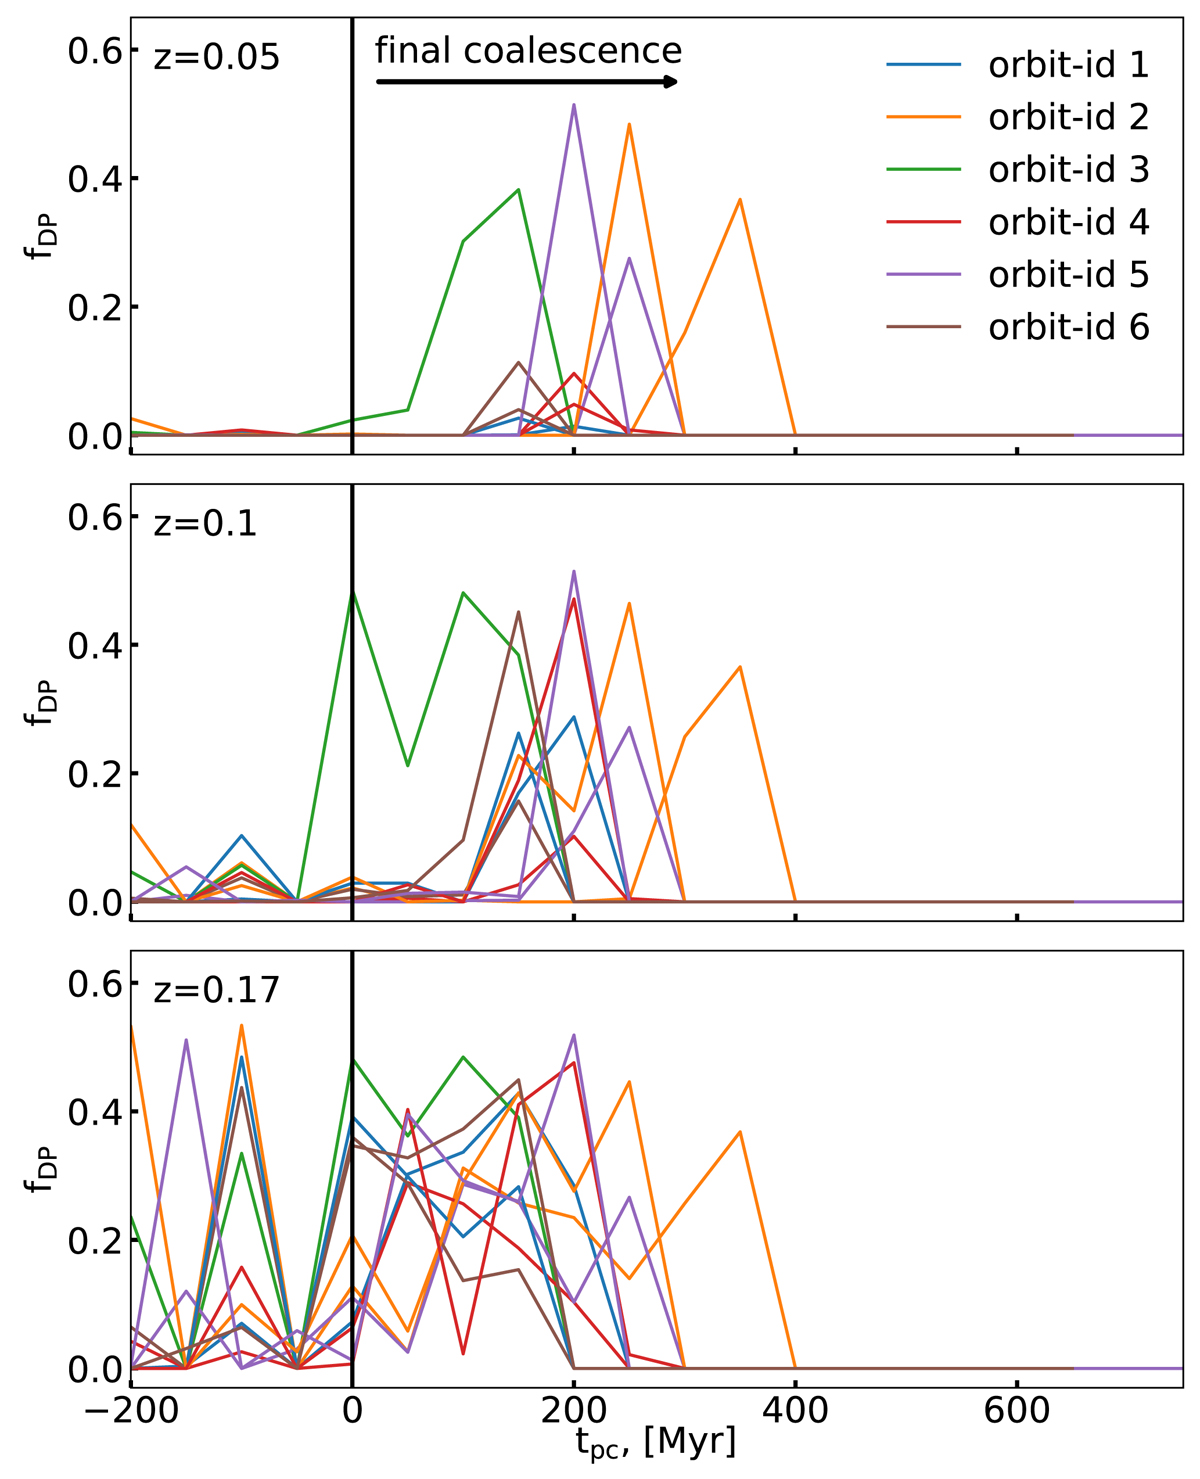
Fig. 17.
Download original image
Double peak fraction observed at different redshifts after the final coalescence of minor-merger simulation. On the x-axis, we show the post-coalescence time tpc, starting at the moment of final coalescence. The moment of final coalescence is marked by a black line and the values of DP-fraction are indicated on the y-axis. The line colour represents the orbit-id specified in Table A.2.
Current usage metrics show cumulative count of Article Views (full-text article views including HTML views, PDF and ePub downloads, according to the available data) and Abstracts Views on Vision4Press platform.
Data correspond to usage on the plateform after 2015. The current usage metrics is available 48-96 hours after online publication and is updated daily on week days.
Initial download of the metrics may take a while.