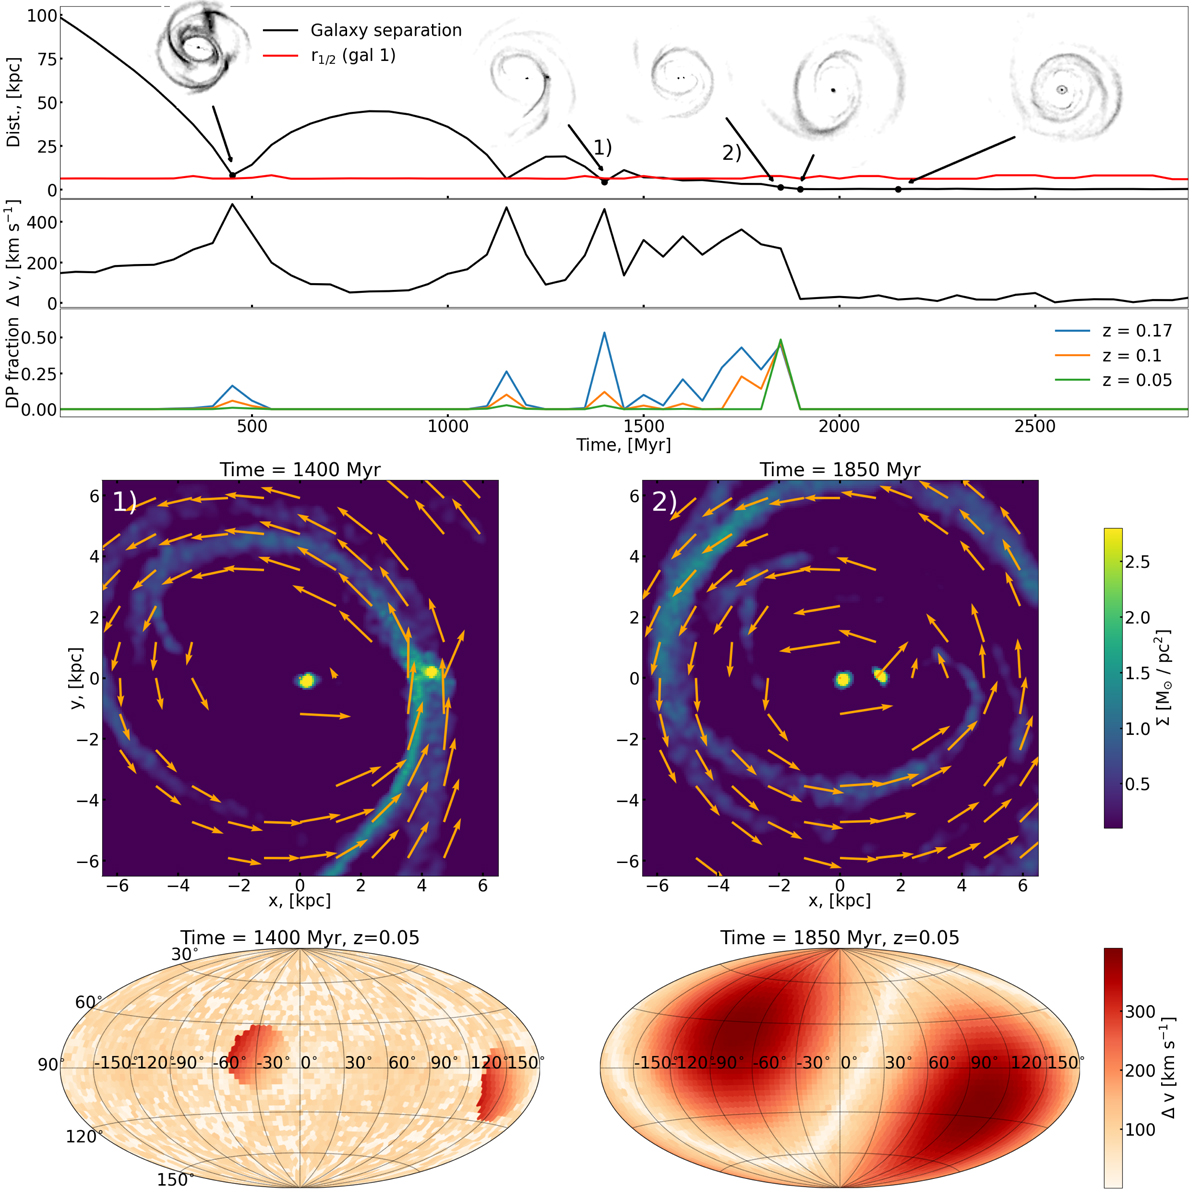
Fig. 16.

Download original image
Visualisation of a minor merger between a gSa + dSd, simulated with the orbit-id 3 and a direct collision. We show the top panels and two 2D projected gas maps in the same manner as described in Fig. 11. We show two specific snapshots: one close encounter and the moment of final coalescence. The two 2D-projected snapshots are indicated with numbers to better assign them to the orbit, shown on the top. On the two bottom panels, we show direction maps and indicate, with colour maps, the Δv measured with the double-Gaussian fit to each observed spectrum.
Current usage metrics show cumulative count of Article Views (full-text article views including HTML views, PDF and ePub downloads, according to the available data) and Abstracts Views on Vision4Press platform.
Data correspond to usage on the plateform after 2015. The current usage metrics is available 48-96 hours after online publication and is updated daily on week days.
Initial download of the metrics may take a while.


