Fig. 12.
Download original image
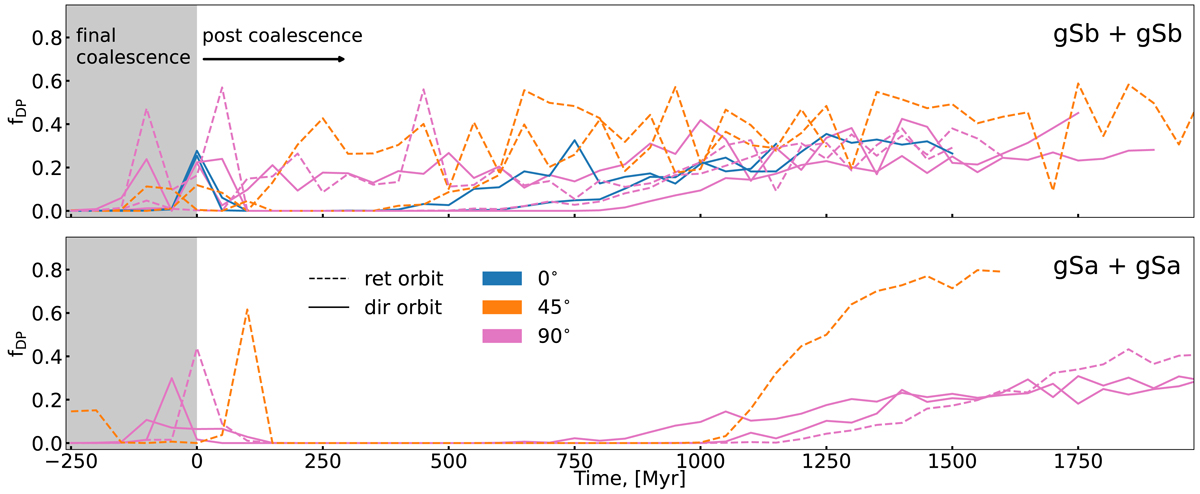
Evolution of the DP fraction of major-merger simulations after the final coalescence observed at z = 0.05. We identify the snapshot in each simulation where the distance between the two galaxies remains below the half mass radius of the first galaxy for the rest of the simulation. We use this snapshot as reference point and show the time starting 250 Myr before this snapshot on the x-axis. On the y-axis, we show the DP fraction fDP. On the top (resp. bottom) panel, we show gSb + gSb (resp. gSa + gSa) simulations. We mark the time before the final coalescence in grey. We mark simulations with an inclination of 0°, 45° and 90° of the second disc (see Fig. 10) with blue, orange and pink lines, respectively. Mergers with direct (resp. retrograde) orbit are presented by solid (resp. dashed) lines.
Current usage metrics show cumulative count of Article Views (full-text article views including HTML views, PDF and ePub downloads, according to the available data) and Abstracts Views on Vision4Press platform.
Data correspond to usage on the plateform after 2015. The current usage metrics is available 48-96 hours after online publication and is updated daily on week days.
Initial download of the metrics may take a while.