Fig. 11.
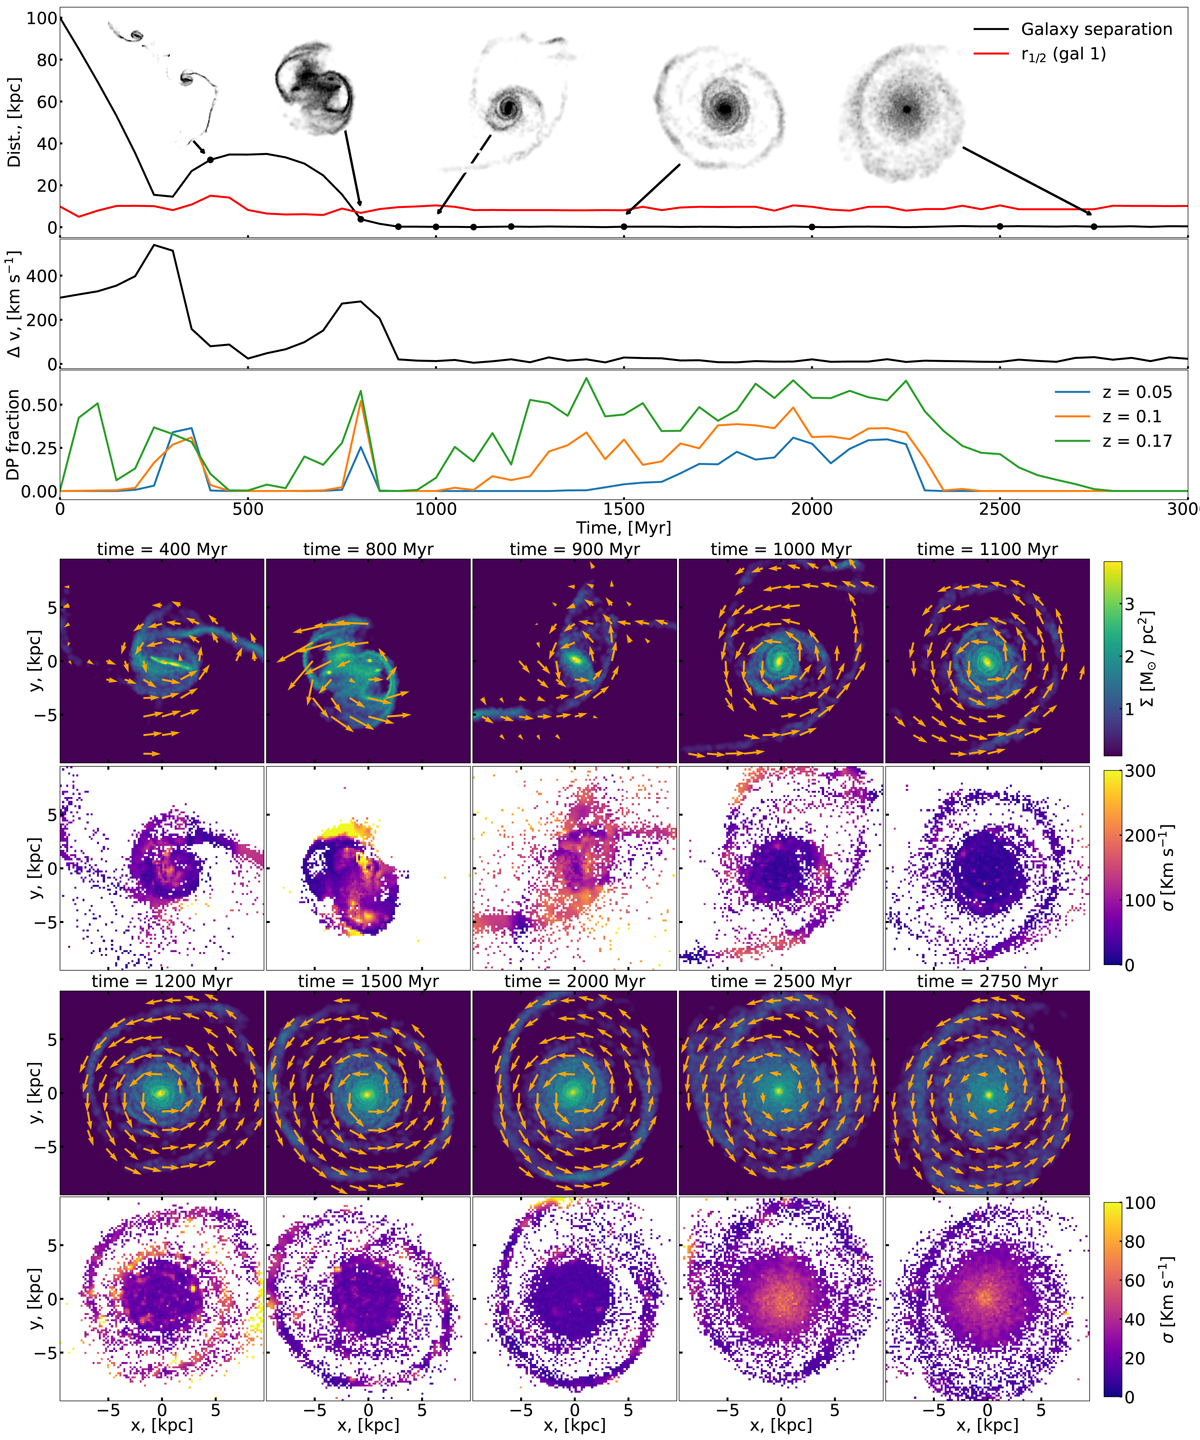
Download original image
Visualisation of a major merger process. We show characteristic parameters of the galaxy merger simulation of gSb + gSb with an orbit id 02dir and a merger inclination of 0° (see Sect. 4.1 and Table A.2). On the top panel, we show with a black line the distance between the COM of the two galaxies which corresponds to the distance between the two galaxies. The red line represents the half mass radius r1/2 of the first galaxy. In order to illustrate the merger process, we show snapshots of only the gas at different merger stages. Black arrows indicate the exact stage of the merger process. On the second panel, we show the velocity difference between the two COM. On the third panel, we show the DP fraction which corresponds to the fraction of observation angles from which one detects a DP. On the bottom panels, we show zoomed-in observations of the central kiloparsecs of the first galaxy, we display, on the top panels, the 2D projection of the gas surface density Σ observed from a face-on view and the measured velocity dispersion σ on the panels beneath. To illustrate the gas dynamics, we show arrows representing the 2D projected in-plane velocity of the particles.
Current usage metrics show cumulative count of Article Views (full-text article views including HTML views, PDF and ePub downloads, according to the available data) and Abstracts Views on Vision4Press platform.
Data correspond to usage on the plateform after 2015. The current usage metrics is available 48-96 hours after online publication and is updated daily on week days.
Initial download of the metrics may take a while.