Fig. 1.
Download original image
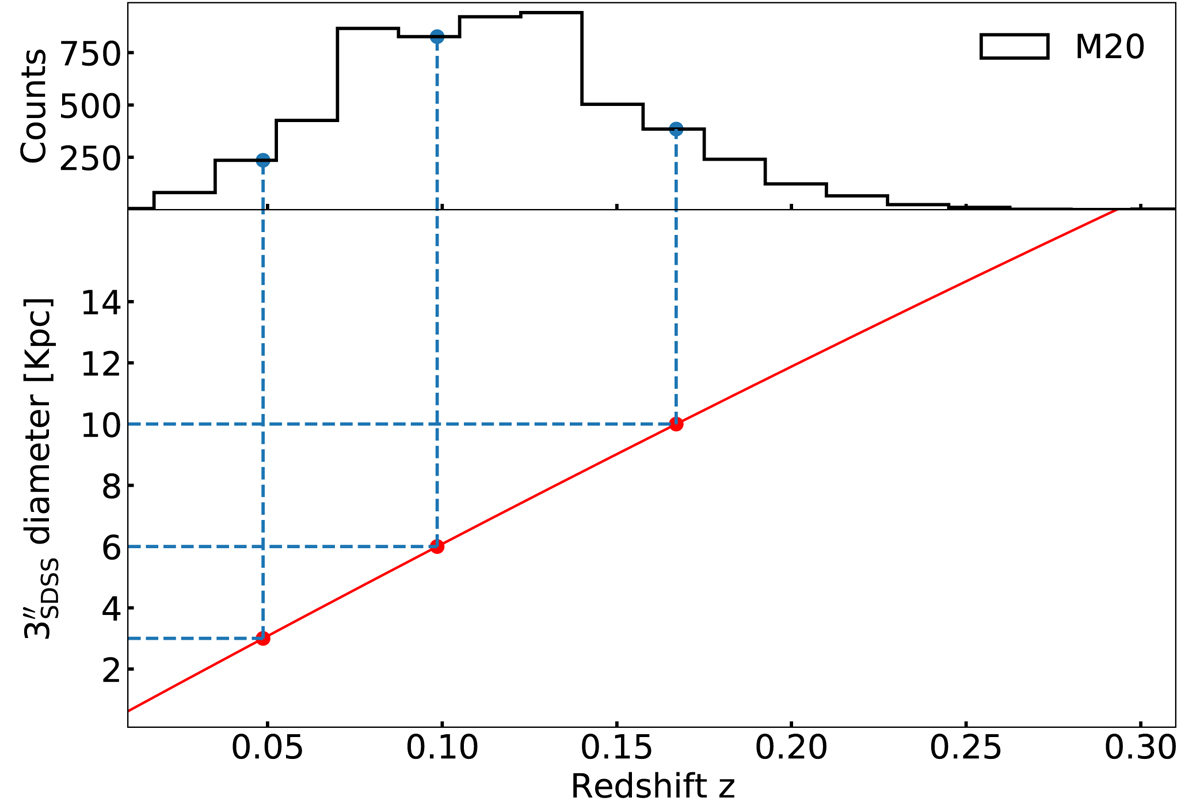
Redshift distribution of the DP galaxy sample (M20) (top panel) and the conversion curve between redshift and the fibre diameter in kpc of the SDSS 3″ (red curve in the bottom panel). We mark with blue dashed line the three representative redshifts and corresponding fibre diameters: z = 0.05, z = 0.1, and z = 0.17 corresponding to a fibre diameter of 3, 6, and 10 kpc, respectively.
Current usage metrics show cumulative count of Article Views (full-text article views including HTML views, PDF and ePub downloads, according to the available data) and Abstracts Views on Vision4Press platform.
Data correspond to usage on the plateform after 2015. The current usage metrics is available 48-96 hours after online publication and is updated daily on week days.
Initial download of the metrics may take a while.