Fig. 5.
Download original image
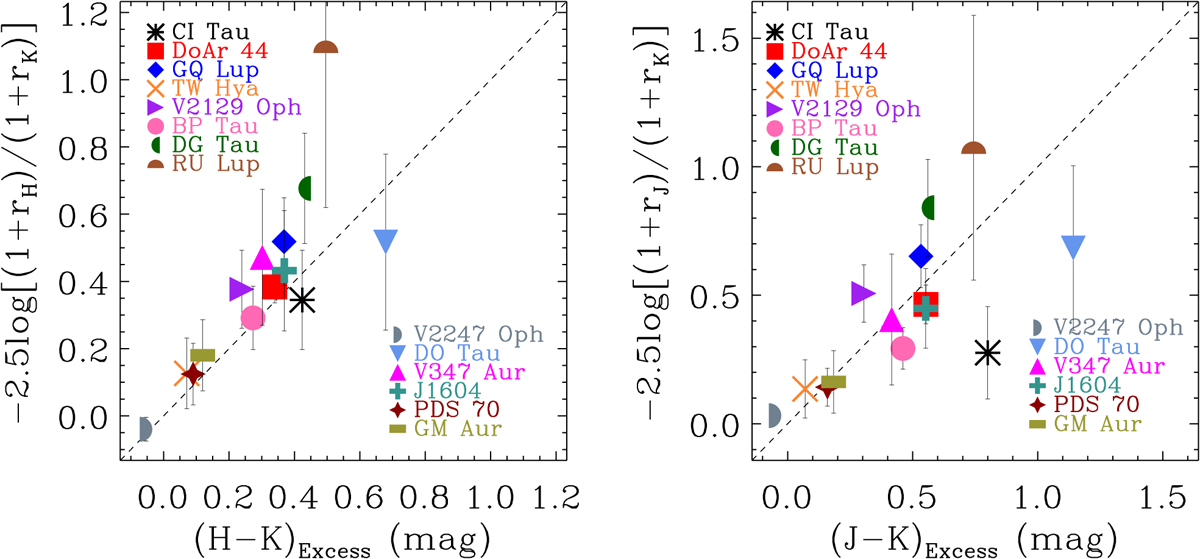
Comparison between the color excess computed using the average NIR veiling and the 2MASS photometry. Left: (H − Ks)excess, right: (J − Ks)excess. See the text for the color excess definition. The dashed line represents a slope equal to 1. The NIR color excesses computed using the average veiling and the 2MASS magnitudes agree for most targets.
Current usage metrics show cumulative count of Article Views (full-text article views including HTML views, PDF and ePub downloads, according to the available data) and Abstracts Views on Vision4Press platform.
Data correspond to usage on the plateform after 2015. The current usage metrics is available 48-96 hours after online publication and is updated daily on week days.
Initial download of the metrics may take a while.