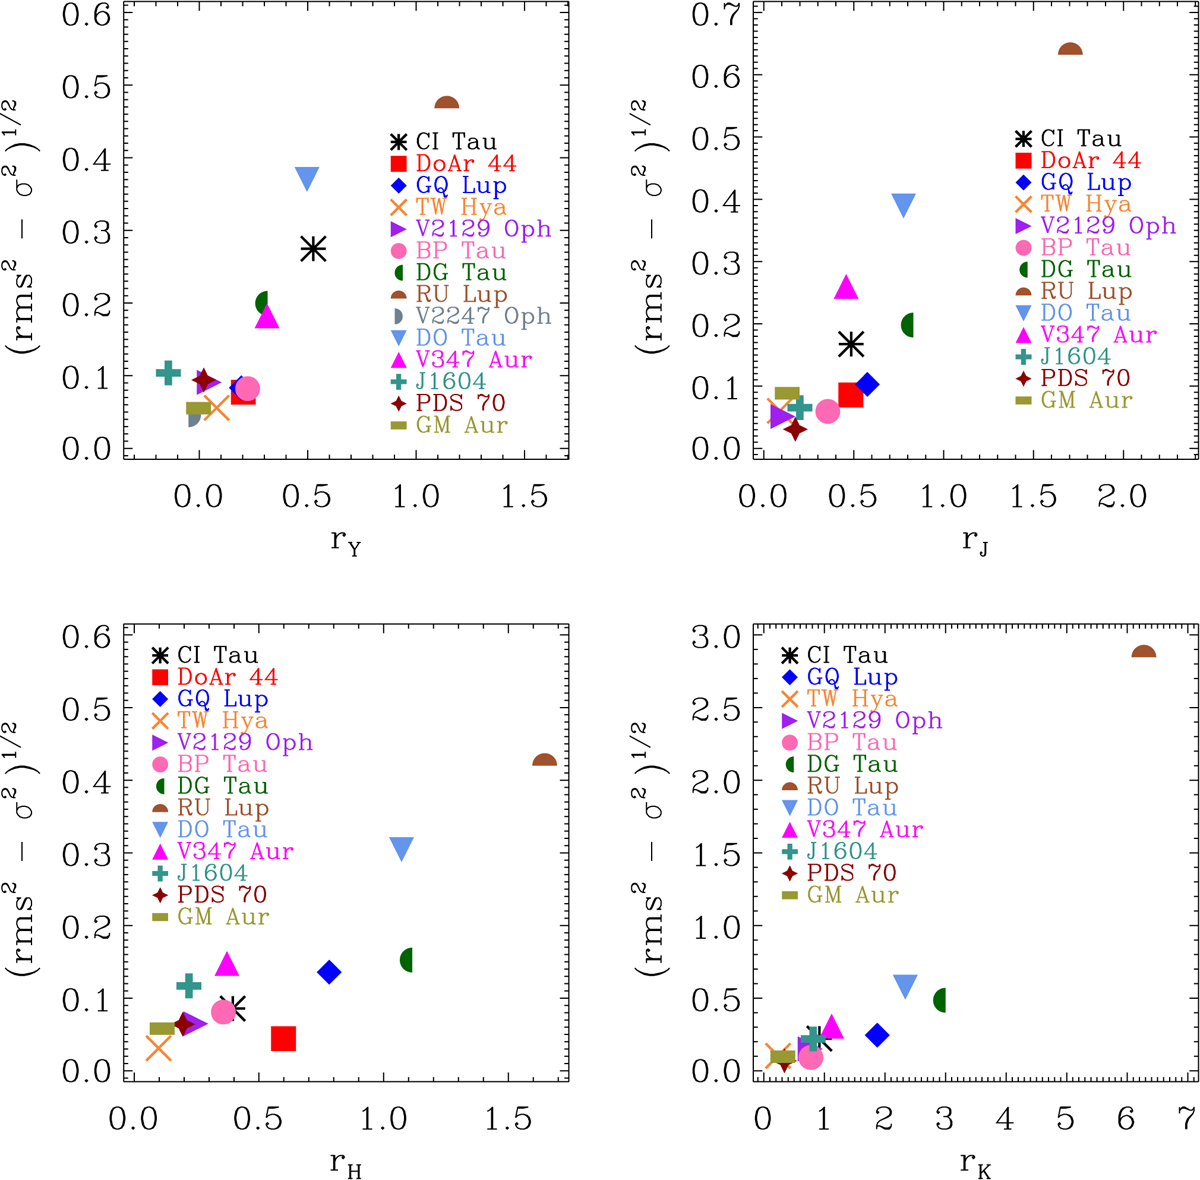
Fig. 3.
Download original image
Veiling variability diagnostic as a function of the average veiling. The rms value refers to the root-mean-square of the veiling variability and σ is the average error on the veiling measurements. Each panel shows the veiling rλ measured in a different band (YJHK). Systems with higher veiling also present higher veiling variability.
Current usage metrics show cumulative count of Article Views (full-text article views including HTML views, PDF and ePub downloads, according to the available data) and Abstracts Views on Vision4Press platform.
Data correspond to usage on the plateform after 2015. The current usage metrics is available 48-96 hours after online publication and is updated daily on week days.
Initial download of the metrics may take a while.