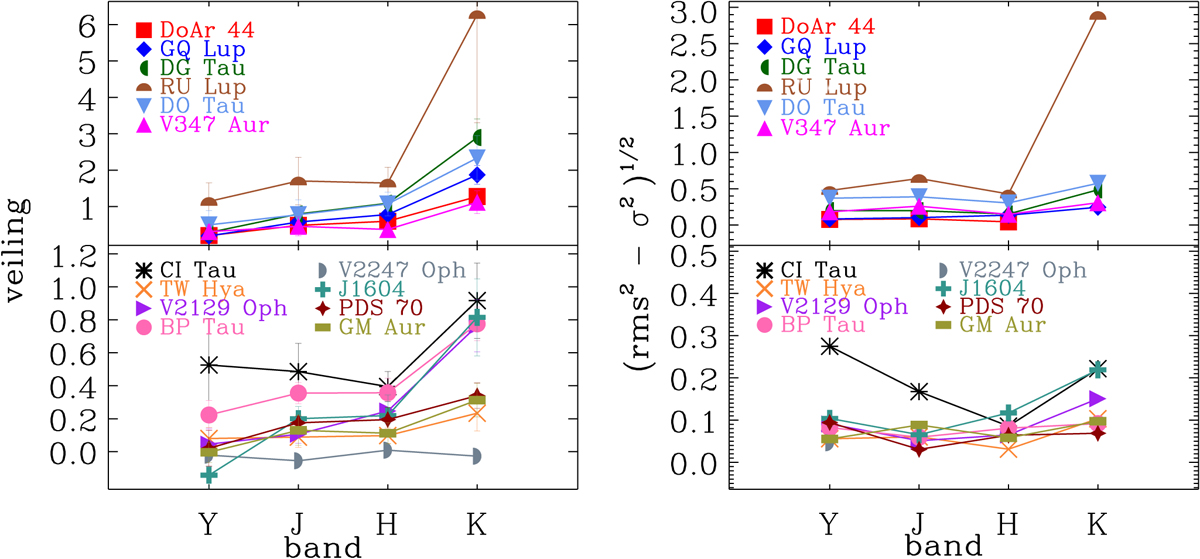
Fig. 2.
Download original image
Average NIR veiling (left) and the veiling variability diagnostic (right) measured in different wavelength regions. The top and bottom panels show the targets with rK higher and lower than 1, respectively. The veiling increases from the Y to the K band for most of the targets. The error bars in the left panel represent the standard deviation of the average veiling over all the observation nights. In this figure and the following figures, the color and symbol codes in the panels identify each target.
Current usage metrics show cumulative count of Article Views (full-text article views including HTML views, PDF and ePub downloads, according to the available data) and Abstracts Views on Vision4Press platform.
Data correspond to usage on the plateform after 2015. The current usage metrics is available 48-96 hours after online publication and is updated daily on week days.
Initial download of the metrics may take a while.