Fig. 1.
Download original image
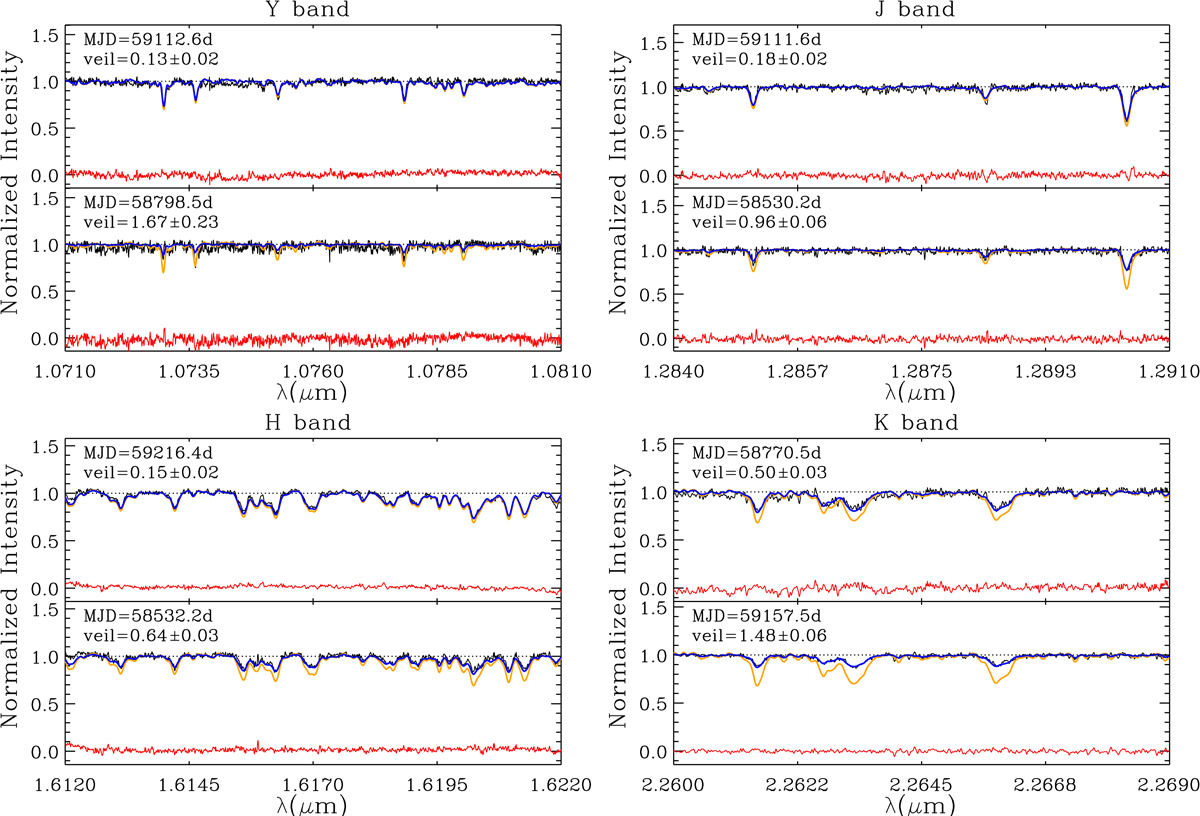
Examples of the four spectral regions used to measure the veiling of CI Tau. In each panel, we show two different nights, representing a small and a high veiling estimated for this target. We show the CI Tau spectrum in black and the residual profile (in red) obtained after subtracting the veiled template. The V819 Tau template spectra are also displayed before (orange) and after (blue) applying the veiling correction. The photospheric lines were removed in the residual profiles, showing that the veiling was accurately determined for most nights.
Current usage metrics show cumulative count of Article Views (full-text article views including HTML views, PDF and ePub downloads, according to the available data) and Abstracts Views on Vision4Press platform.
Data correspond to usage on the plateform after 2015. The current usage metrics is available 48-96 hours after online publication and is updated daily on week days.
Initial download of the metrics may take a while.