Open Access
Fig. 1
Download original image
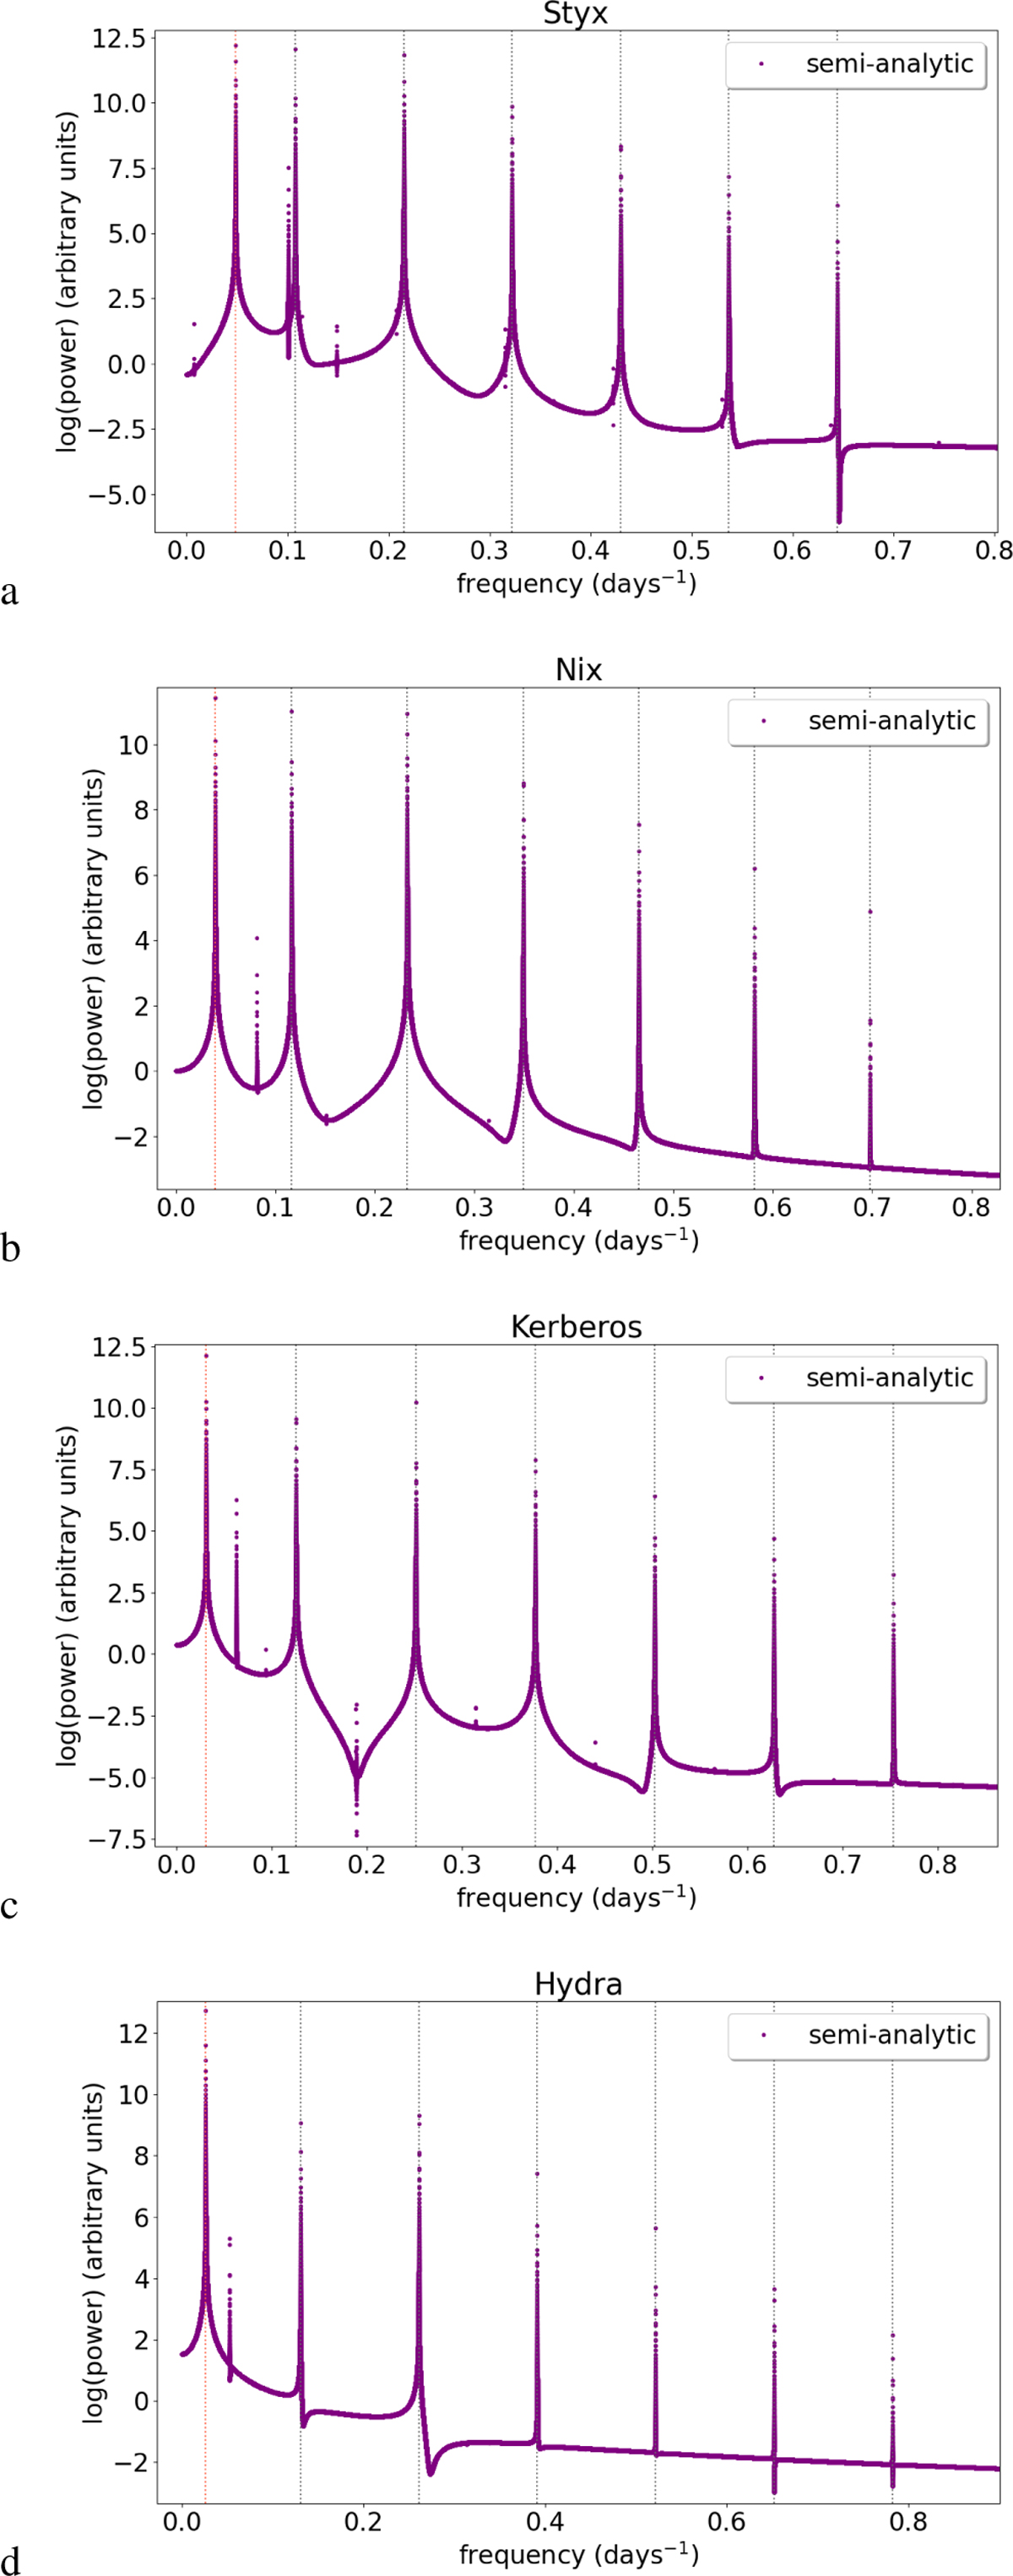
FFT power spectrum for all small moons using the semi-analytic approach. In each panel the red vertical line represents the epicyclic frequency of the moon (υe) and the gray lines the synodic frequency and its harmonics (k nsyn), as shown in Table 2.
Current usage metrics show cumulative count of Article Views (full-text article views including HTML views, PDF and ePub downloads, according to the available data) and Abstracts Views on Vision4Press platform.
Data correspond to usage on the plateform after 2015. The current usage metrics is available 48-96 hours after online publication and is updated daily on week days.
Initial download of the metrics may take a while.