Fig. 9.
Download original image
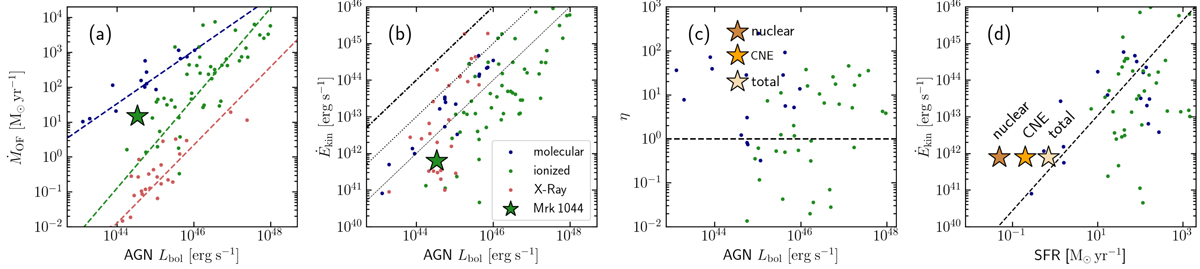
Comparing Mrk 1044’s integrated ionised gas outflow with AGN multi-phase outflow scaling relations. The coloured data points are taken from Fiore et al. (2017) and show the molecular gas outflows traced by CO, OH (blue), ionised gas outflows (green) and X-ray outflows (red). Panel (a) shows the outflowing ionised gas mass. The dashed coloured lines correspond to the correlations for the respective gas phase reported by Fiore et al. (2017). Panel (b) shows the AGN wind kinetic power where the dashed, dotted and dash-dotted line correspond to the ![]() . Panel (c) shows the mass loading factor η = ṀOF/SFR. Here, the brown star represents Mrk 1044’s SF in the immediate vicinity (< 160 pc) from the centre, the orange point to that of the SF in the CNE and the yellow point to that of Mrk 1044’s galaxy-wide SFR. Panel (d) shows the kinetic outflow power as a function of SFR. The solid red line indicates the predicted SFR from the AGN bolometric luminosity using the relation from Netzer (2009) together with the average
. Panel (c) shows the mass loading factor η = ṀOF/SFR. Here, the brown star represents Mrk 1044’s SF in the immediate vicinity (< 160 pc) from the centre, the orange point to that of the SF in the CNE and the yellow point to that of Mrk 1044’s galaxy-wide SFR. Panel (d) shows the kinetic outflow power as a function of SFR. The solid red line indicates the predicted SFR from the AGN bolometric luminosity using the relation from Netzer (2009) together with the average ![]() for molecular outflows (Fiore et al. 2017). Compared to the ionised gas outflows in the sample, Mrk 1044’s outflow carries a lot of mass in the ionised gas phase. Its mass injection into the ISM exceeds the current SFR in the immediate vicinity of the nucleus, but also compared to the galaxy-wide values.
for molecular outflows (Fiore et al. 2017). Compared to the ionised gas outflows in the sample, Mrk 1044’s outflow carries a lot of mass in the ionised gas phase. Its mass injection into the ISM exceeds the current SFR in the immediate vicinity of the nucleus, but also compared to the galaxy-wide values.
Current usage metrics show cumulative count of Article Views (full-text article views including HTML views, PDF and ePub downloads, according to the available data) and Abstracts Views on Vision4Press platform.
Data correspond to usage on the plateform after 2015. The current usage metrics is available 48-96 hours after online publication and is updated daily on week days.
Initial download of the metrics may take a while.