Fig. 8.
Download original image
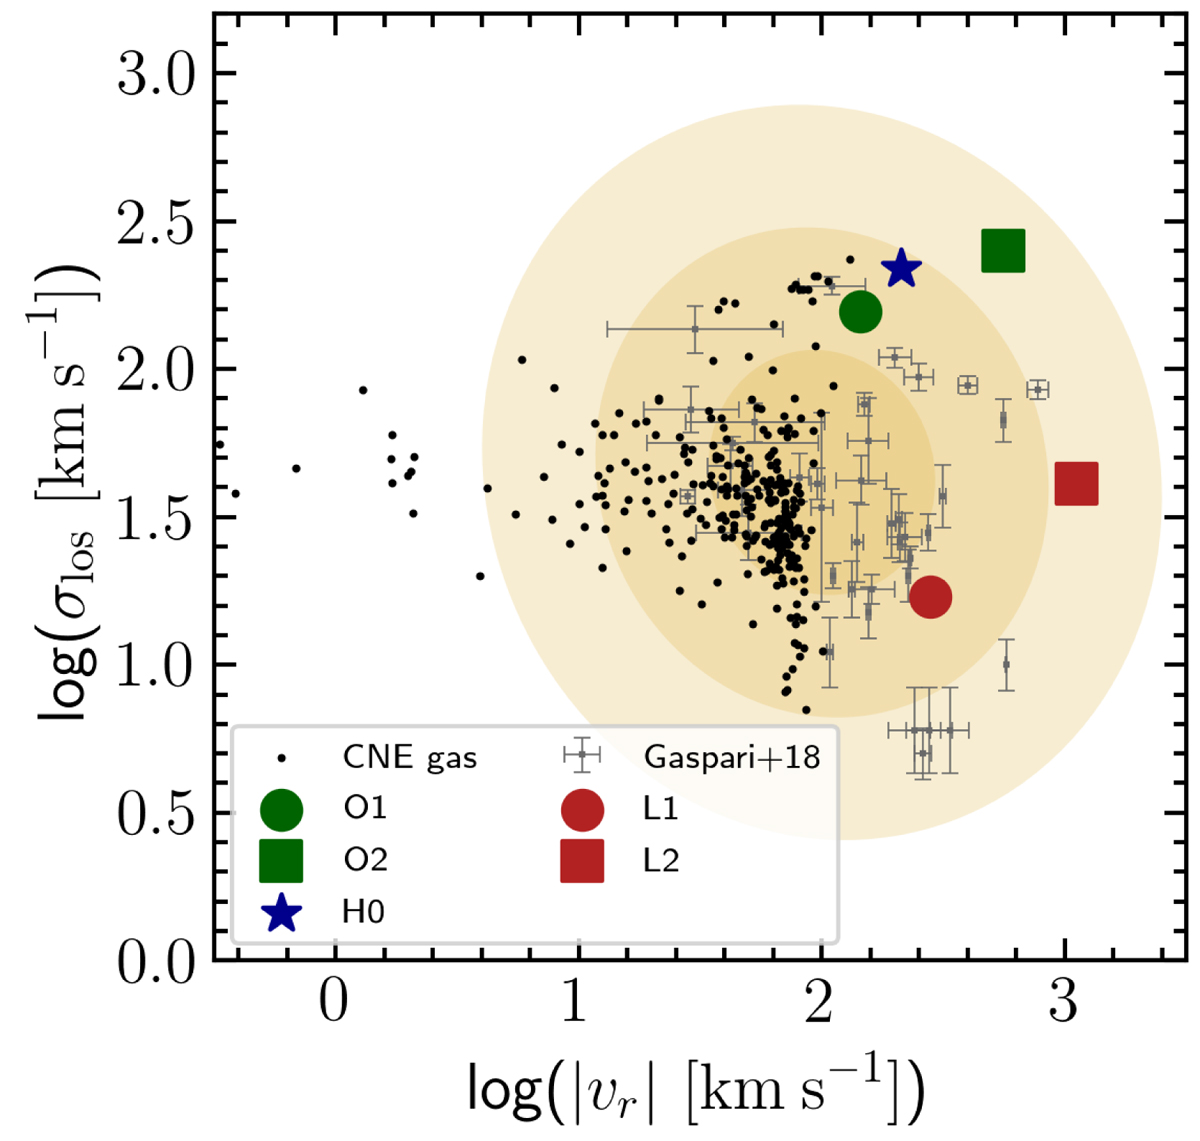
Kinematical plot (k-plot) of the line broadening versus the line shift. It highlights the relative importance of chaotic/turbulent motions versus laminar/bulk motions and the connected physical processes. The yellow contours show the 1-3σ confidence intervals for the chaotic cold accretion (CCA) feeding mode found by high-resolution hydrodynamical simulations (Gaspari et al. 2018). The grey data points indicate measurements of warm and cold condensed gas in diverse galaxies (Gaspari et al. 2018). The ionised gas of Mrk 1044’s CNE is shown as black data points. The tail towards lower velocity is mainly driven by an inclined rotating disc, with several points overlapping with the main CCA area. In contrast, the four nuclear components (red and green points) have substantially higher bulk velocity indicating that they are not kinematically associated with the disc, but rather outflowing, in particular O2 and L2 (squares). O1 and L1 appear to interact more significantly with the surrounding medium, thus being more prone to turbulent condensation.
Current usage metrics show cumulative count of Article Views (full-text article views including HTML views, PDF and ePub downloads, according to the available data) and Abstracts Views on Vision4Press platform.
Data correspond to usage on the plateform after 2015. The current usage metrics is available 48-96 hours after online publication and is updated daily on week days.
Initial download of the metrics may take a while.