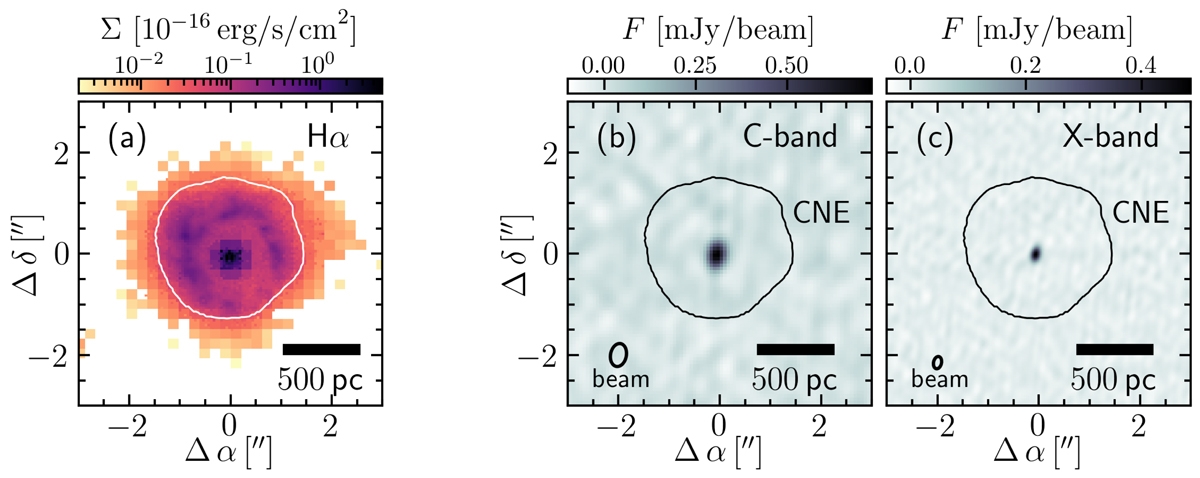
Fig. 4.
Download original image
Mrk 1044’s nuclear region seen in the optical (left) and radio emission (right). Panel (a) shows the surface brightness map of the Hα narrow line emission extracted as described in Paper I. The panels on the right show the broad-band EVLA images of the radio emission in the C-band (b) and X-band (c) with the corresponding FWHM-contour of the beam shown in the lower left corner respectively. The contours of the star forming CNE encompassing the nucleus are shown as black contours (see Paper I). In both C- and X-band the nuclear radio emission is unresolved by VLA.
Current usage metrics show cumulative count of Article Views (full-text article views including HTML views, PDF and ePub downloads, according to the available data) and Abstracts Views on Vision4Press platform.
Data correspond to usage on the plateform after 2015. The current usage metrics is available 48-96 hours after online publication and is updated daily on week days.
Initial download of the metrics may take a while.