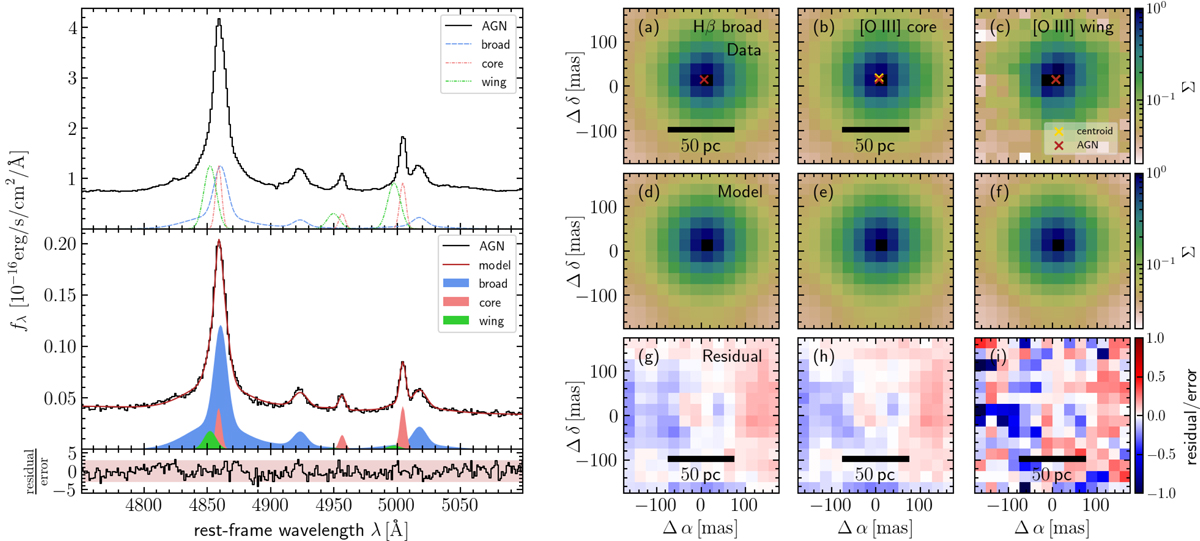
Fig. 2.
Download original image
Spectroastrometric analysis of Mrk 1044’s central region using the original MUSE NFM-AO data cube. The left panels show an arbitrary example spectrum that is picked from the small window around the nucleus shown in the panels on the right. To fit the spectrum, we keep the kinematics and line ratios of the kinematics fixed to that of the components found in the AGN spectrum. The panels on the right show the surface brightness within the central 150 mas for the kinematic components where the flux maps are normalised to their peak flux. Here we only show the measured light distribution from the BLR Hβ (left), [O III]-wing (middle), and narrow [O III]-core (right) component. From top to bottom the maps show the 2D light distributions, the best-fit model of the PSF and the residual maps. The red cross indicates the PSFAO19 centroid for the best-fit PSFAO19 fit to the BLR Hβ. The green and white crosses indicate the centroids for the PSFAO19 models to the surface brightness maps of the [O III]-wing and core respectively, in which the amplitude and position of the Moffat model were varied only. The offset of both [O III] core and wing component from the AGN position are smaller than 0.1 px.
Current usage metrics show cumulative count of Article Views (full-text article views including HTML views, PDF and ePub downloads, according to the available data) and Abstracts Views on Vision4Press platform.
Data correspond to usage on the plateform after 2015. The current usage metrics is available 48-96 hours after online publication and is updated daily on week days.
Initial download of the metrics may take a while.