Fig. B.3.
Download original image
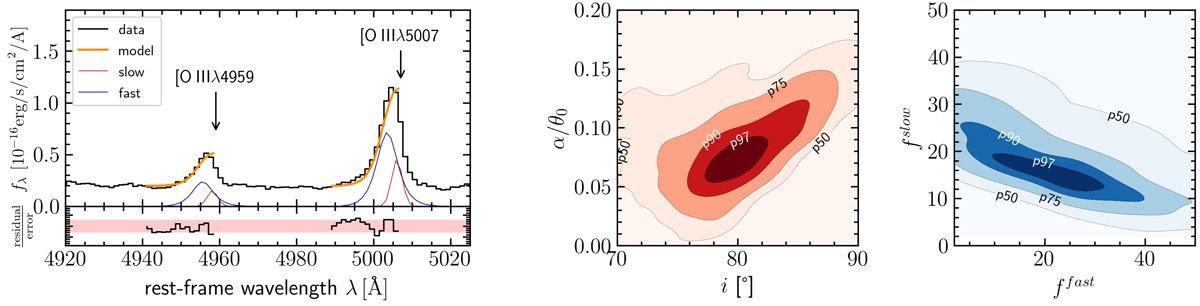
Best-fitting model for the blue shoulder of Mrk 1044’s [O III]λλ4959,5007 emission line. The left panel shows the AGN spectrum (black line) around the [O III] doublet emission. The best-fit model (orange line) reproduces the line shape well. Both the slow (red line) and the fast shell (blue line) contribute to the asymmetric line shape. The panels on the right show percentile regions of the posterior distribution for the geometric parameters (left) and the flux contribution (right) respectively.
Current usage metrics show cumulative count of Article Views (full-text article views including HTML views, PDF and ePub downloads, according to the available data) and Abstracts Views on Vision4Press platform.
Data correspond to usage on the plateform after 2015. The current usage metrics is available 48-96 hours after online publication and is updated daily on week days.
Initial download of the metrics may take a while.