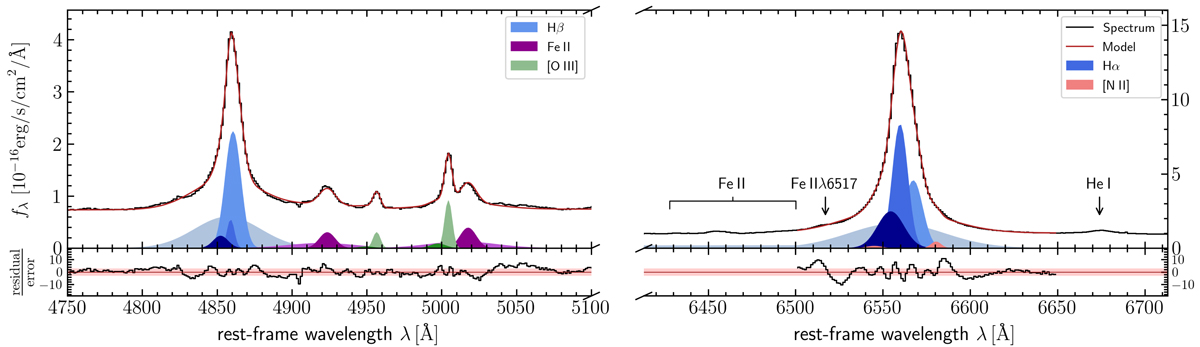
Fig. 1.
Download original image
Modelling Mrk 1044’s AGN spectrum in the Hβ–[O III] region (left) and Hα–[N II] region (right). To reproduce the observed spectrum (black) we use a multi-Gaussian model for Hβ (blue), [O III] (green), Fe II (purple), Hα (blue, right panel) and [N II] (red). The best-fit spectrum is shown as a red line and well reproduces the prominent emission lines, including the blue shoulder of the [O III] narrow line.
Current usage metrics show cumulative count of Article Views (full-text article views including HTML views, PDF and ePub downloads, according to the available data) and Abstracts Views on Vision4Press platform.
Data correspond to usage on the plateform after 2015. The current usage metrics is available 48-96 hours after online publication and is updated daily on week days.
Initial download of the metrics may take a while.