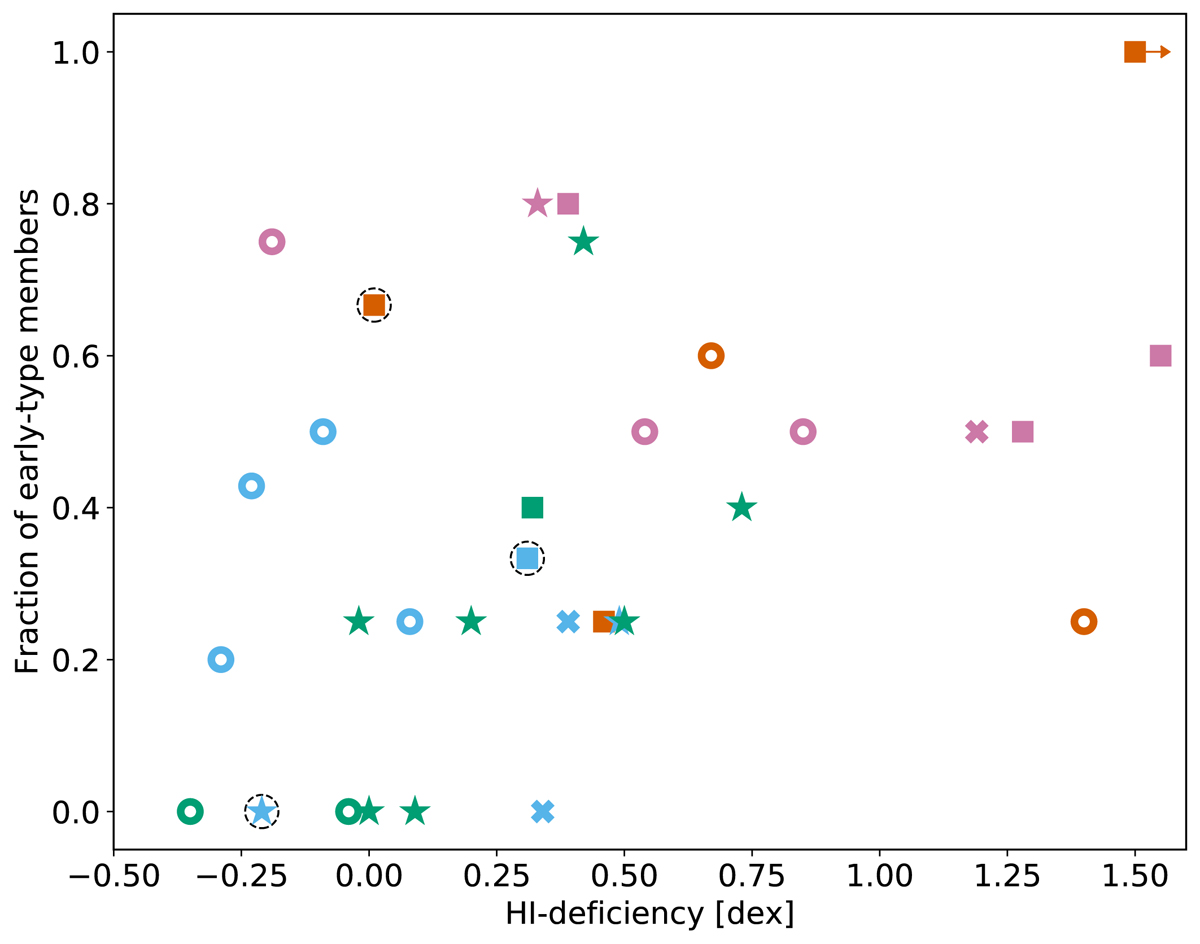
Fig. 82.
Download original image
Histogram of H I deficiencies of HCGs. The three phases are shown individually by differently hatched bars. The vertical black dashed lines indicate approximately the typical 1σ uncertainty (away from zero) in the measure of H I deficiency for an individual galaxy (Jones et al. 2018). Note that HCG 62 is not included as there is only an upper lower limit on its H I deficiency.
Current usage metrics show cumulative count of Article Views (full-text article views including HTML views, PDF and ePub downloads, according to the available data) and Abstracts Views on Vision4Press platform.
Data correspond to usage on the plateform after 2015. The current usage metrics is available 48-96 hours after online publication and is updated daily on week days.
Initial download of the metrics may take a while.