Fig. 81.

Download original image
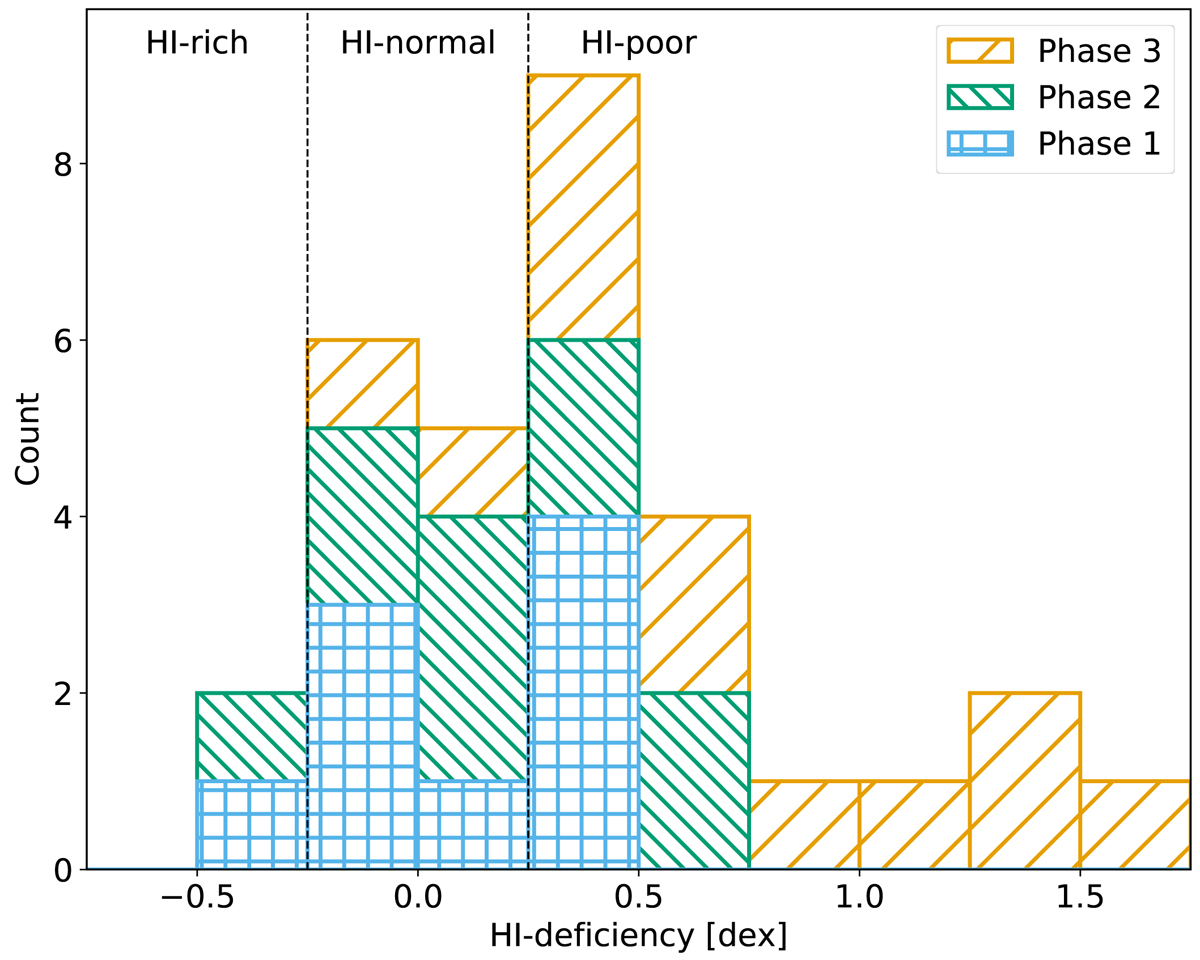
H I deficiencies and extended H I emission fraction for each (resolved) group in the sample. The colour of each point indicates its H I morphological phase: blue for 1, green for 2, orange for 3a, and pink for 3c. The marker shape indicates the IR classification (Zucker et al. 2016) of each group: stars for groups dominated by IR active galaxies, crosses for groups not dominated by either active or quiescent (or transition) galaxies, squares for groups dominated by quiescent (or transition) galaxies, and rings for groups with too many members without IR classifications. Markers enclosed in a dashed black circle correspond to triplets. The lone upper limit plotted in the top-right corner corresponds to HCG 62 that was entirely undetected in H I with the VLA and has no GBT observation. The horizontal dashed lines indicate 25% and 75% extended emission. These thresholds entirely determine which groups are classified as Phase 2 or 3a. Phase 1 and 3c are distinguished from each other based on the number of galaxies detected in H I (Sect. 5.1). The shaded arrows indicate our proposed evolutionary path of groups through this parameter space.
Current usage metrics show cumulative count of Article Views (full-text article views including HTML views, PDF and ePub downloads, according to the available data) and Abstracts Views on Vision4Press platform.
Data correspond to usage on the plateform after 2015. The current usage metrics is available 48-96 hours after online publication and is updated daily on week days.
Initial download of the metrics may take a while.


