Fig. 78.
Download original image
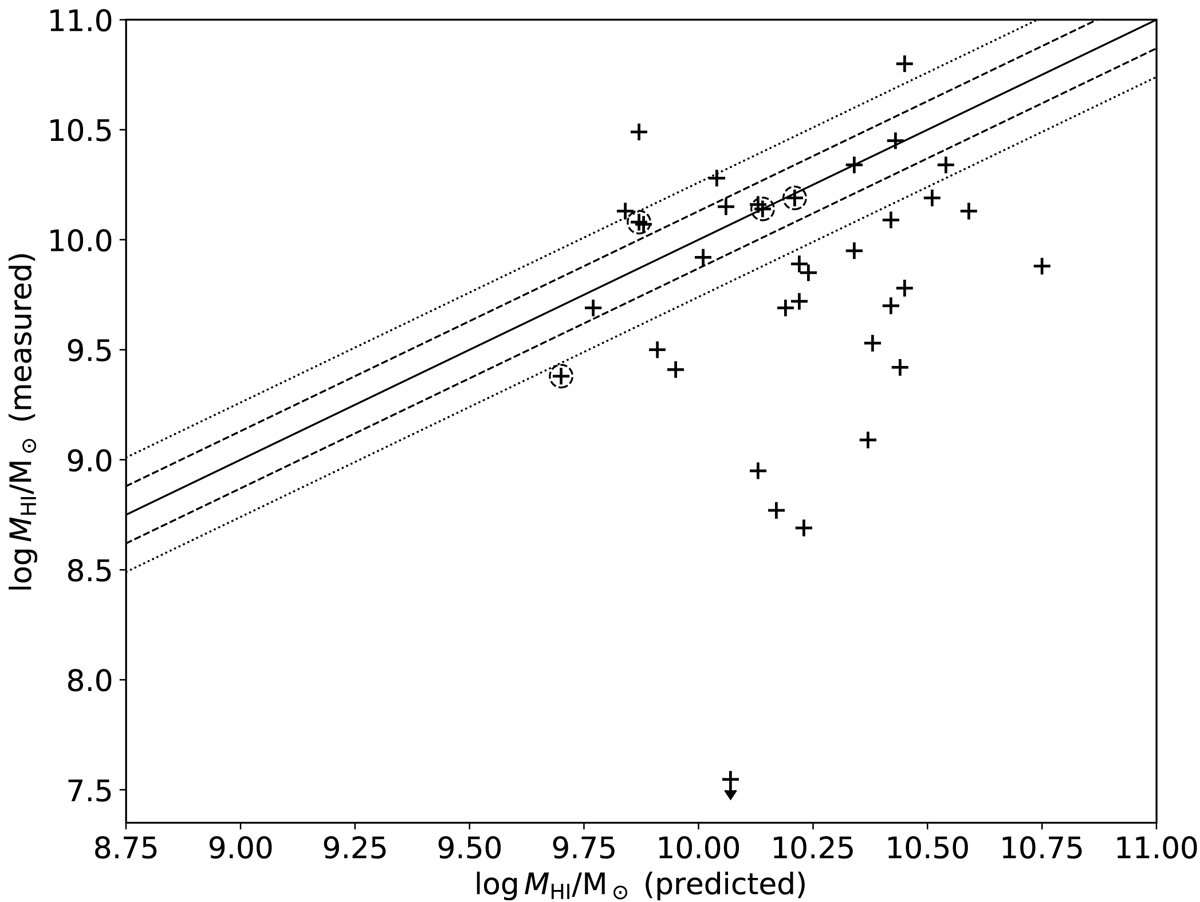
Measured versus predicted (with the Jones et al. (2018)LB–MHI scaling relation) H I masses of HCGs. All measured H I masses are those from the VLA data, except for HCG 30 and 37, which use the GBT measurements. Points circled with black dashed lines are triplets. The solid black line indicates equality and the dashed and dotted lines indicate 1σ and 2σ scatters from the Jones et al. (2018) relation (for a single galaxy). HCG 62 was undetected with the VLA (and has no GBT observation) and is marked as an upper limit.
Current usage metrics show cumulative count of Article Views (full-text article views including HTML views, PDF and ePub downloads, according to the available data) and Abstracts Views on Vision4Press platform.
Data correspond to usage on the plateform after 2015. The current usage metrics is available 48-96 hours after online publication and is updated daily on week days.
Initial download of the metrics may take a while.