Open Access
Fig. 4.
Download original image
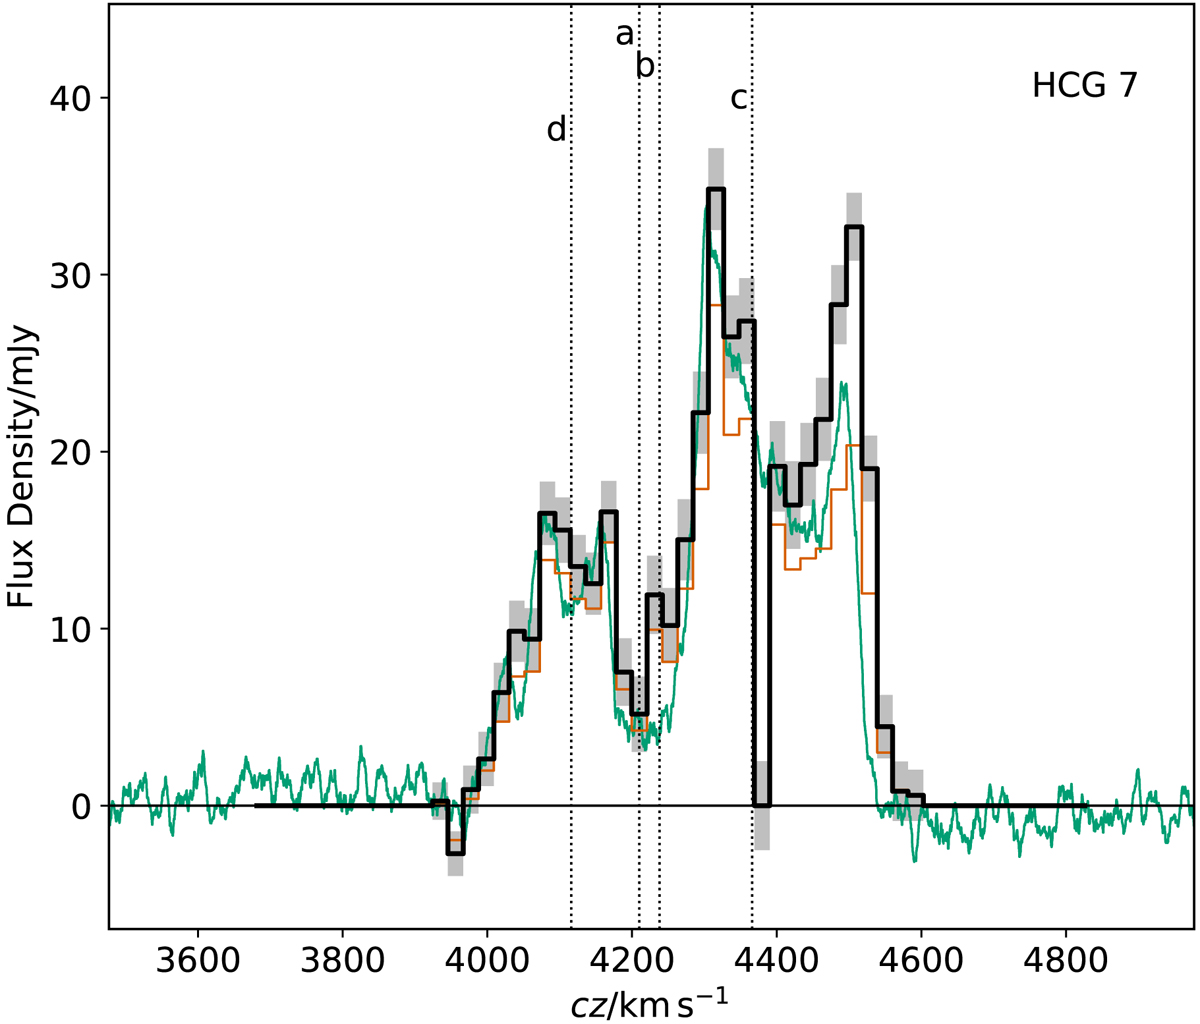
As in Fig. 2. The green (high velocity resolution) spectrum is from the GBT observation of this group (Borthakur et al. 2010), and the orange spectrum is the VLA spectrum weighted to match the GBT primary beam response.
Current usage metrics show cumulative count of Article Views (full-text article views including HTML views, PDF and ePub downloads, according to the available data) and Abstracts Views on Vision4Press platform.
Data correspond to usage on the plateform after 2015. The current usage metrics is available 48-96 hours after online publication and is updated daily on week days.
Initial download of the metrics may take a while.