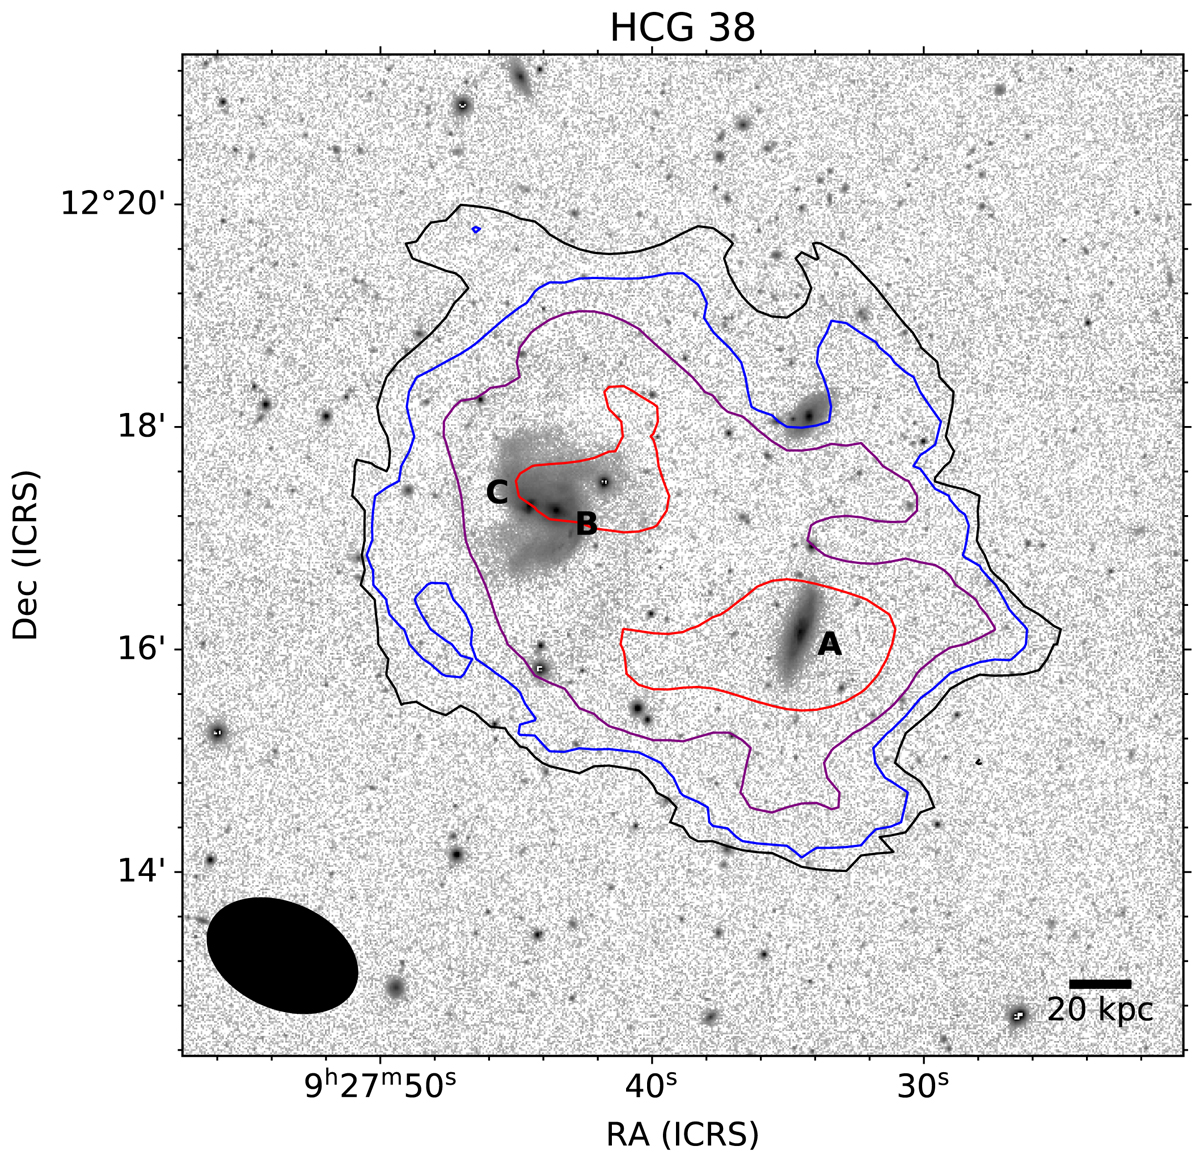
Fig. 29.
Download original image
Integrated H I emission (moment 0) contours overlaid on a DECaLS r-band image. Contours begin at 2σ (solid black lines) and each subsequent contour is a factor of two greater. The dashed black contours indicate −2σ. The VLA synthesised beam is shown as a black ellipse in the bottom left and a 20 kpc scale bar is in the bottom right.
Current usage metrics show cumulative count of Article Views (full-text article views including HTML views, PDF and ePub downloads, according to the available data) and Abstracts Views on Vision4Press platform.
Data correspond to usage on the plateform after 2015. The current usage metrics is available 48-96 hours after online publication and is updated daily on week days.
Initial download of the metrics may take a while.