Fig. 2.
Download original image
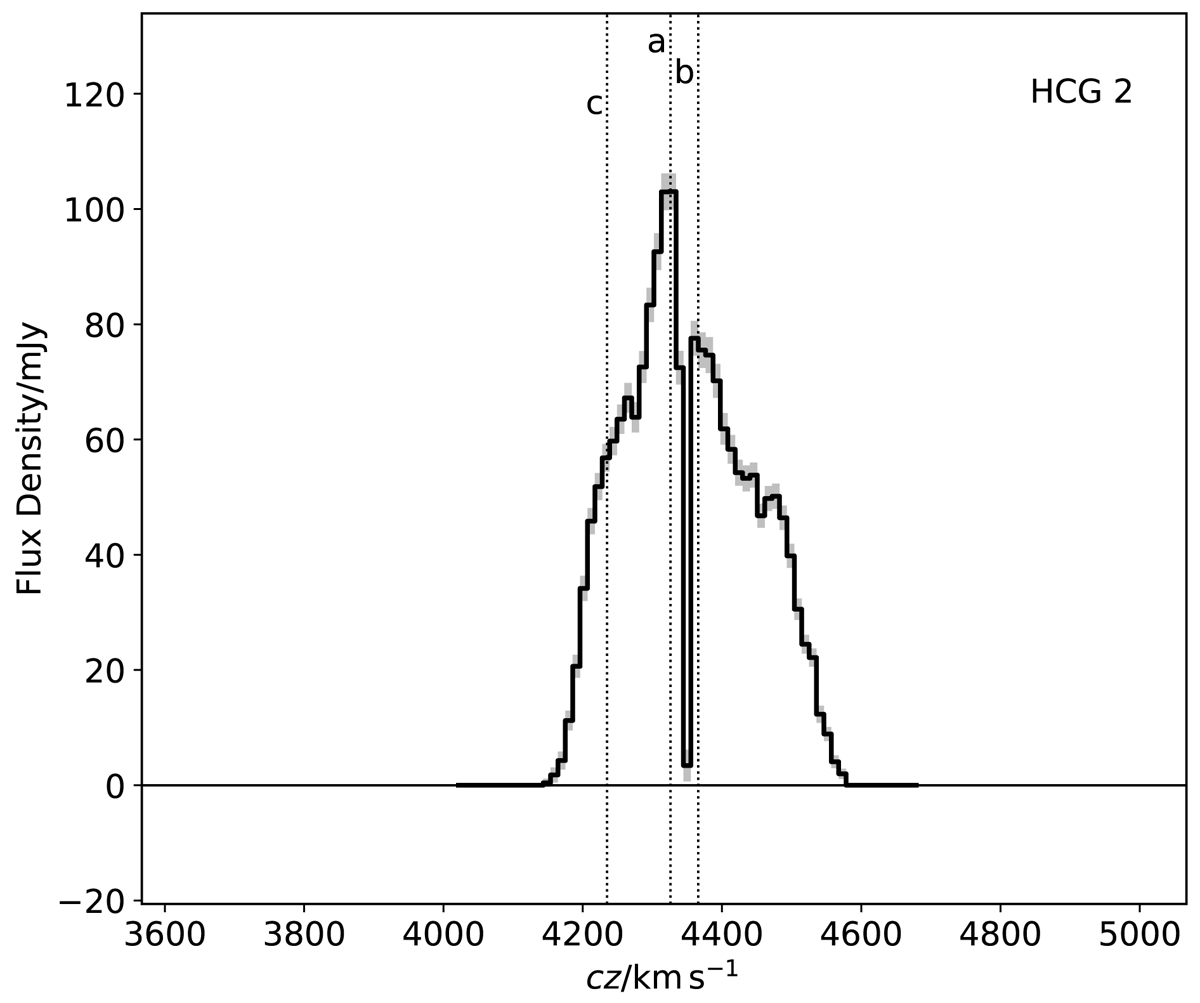
VLA spectrum of all detected H I emission (solid black line) within the primary beam. The light grey shading around the black line indicates the uncertainty based on the rms noise and the number of pixels included in the source mask for a given channel. The vertical dotted lines indicate the velocities of group member galaxies. Regions of the spectrum where all values are exactly zero indicate spectral ranges where there are no pixels in the source mask.
Current usage metrics show cumulative count of Article Views (full-text article views including HTML views, PDF and ePub downloads, according to the available data) and Abstracts Views on Vision4Press platform.
Data correspond to usage on the plateform after 2015. The current usage metrics is available 48-96 hours after online publication and is updated daily on week days.
Initial download of the metrics may take a while.