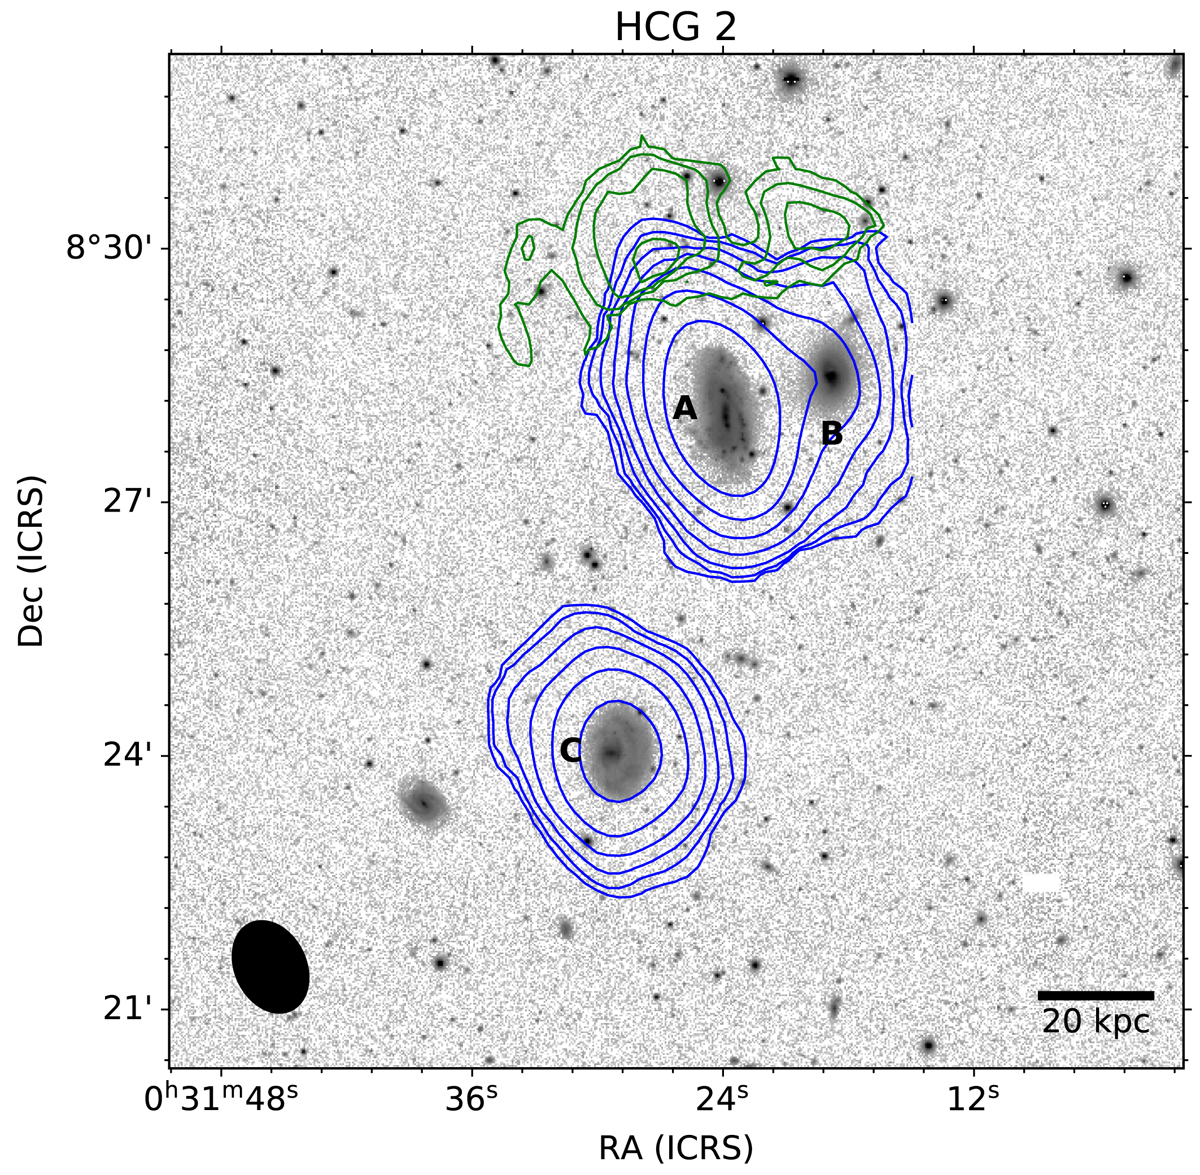
Fig. 1.
Download original image
Integrated H I emission (moment 0) contours overlaid on a DECaLS r-band image. HCG members are shown with blue contours, extended features in green, and non-member galaxies in red (none in this panel). The VLA synthesised beam is shown in the bottom left as a solid black ellipse and a scale bar indicating 20 kpc is in the lower right. The contours start at 4σ (over 20 km s−1) and each subsequent contour is double the one before it. The minimum contour level is listed for each group in Table 1.
Current usage metrics show cumulative count of Article Views (full-text article views including HTML views, PDF and ePub downloads, according to the available data) and Abstracts Views on Vision4Press platform.
Data correspond to usage on the plateform after 2015. The current usage metrics is available 48-96 hours after online publication and is updated daily on week days.
Initial download of the metrics may take a while.