Fig. 3
Download original image
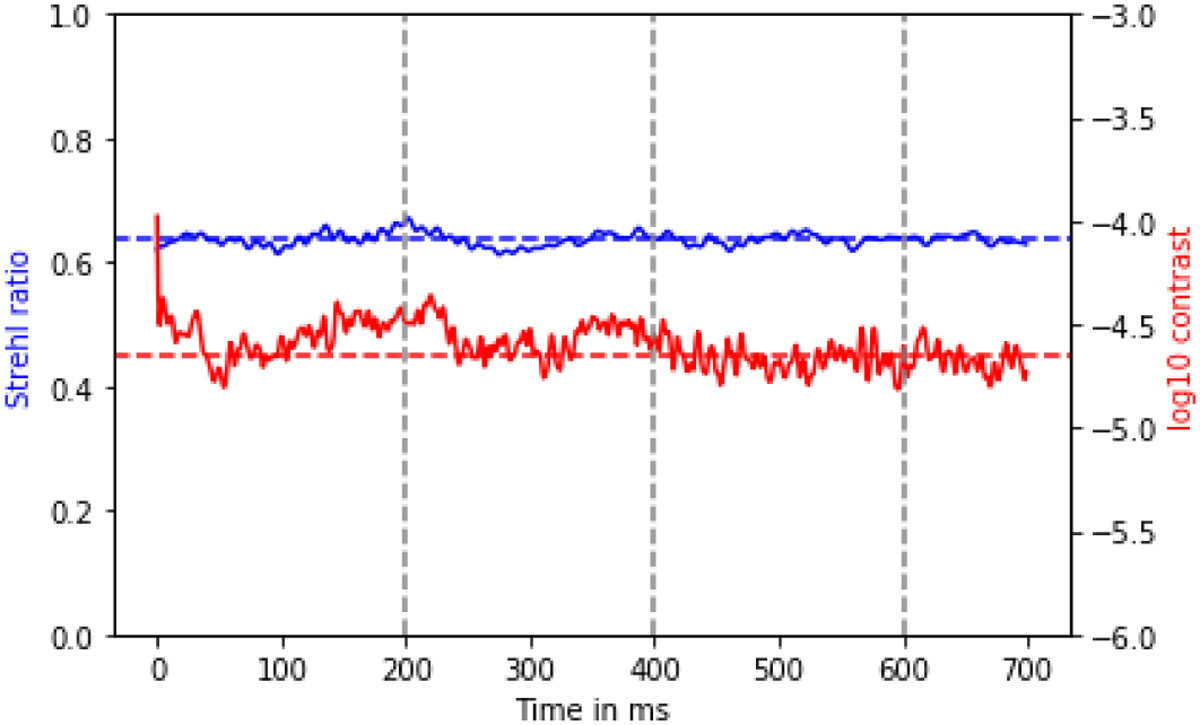
Instantaneous Strehl ratio and the average dark-hole contrast as a function of time. There are no NCPAs in this simulation. The setup is the same as in Fig. 2, but in this case the DM is driven to maximize raw contrast at the dark hole instead of flatten the wavefront. The dashed gray lines are purely for comparison, as they correspond to time stamps at which NCPAs are estimated in later simulations. The dashed blue line indicates the average Strehl ratio and the dashed red line indicates the average raw contrast for the case when there are no NCPAs and the AO is driven to maximize the raw contrast.
Current usage metrics show cumulative count of Article Views (full-text article views including HTML views, PDF and ePub downloads, according to the available data) and Abstracts Views on Vision4Press platform.
Data correspond to usage on the plateform after 2015. The current usage metrics is available 48-96 hours after online publication and is updated daily on week days.
Initial download of the metrics may take a while.