Fig. 6.
Download original image
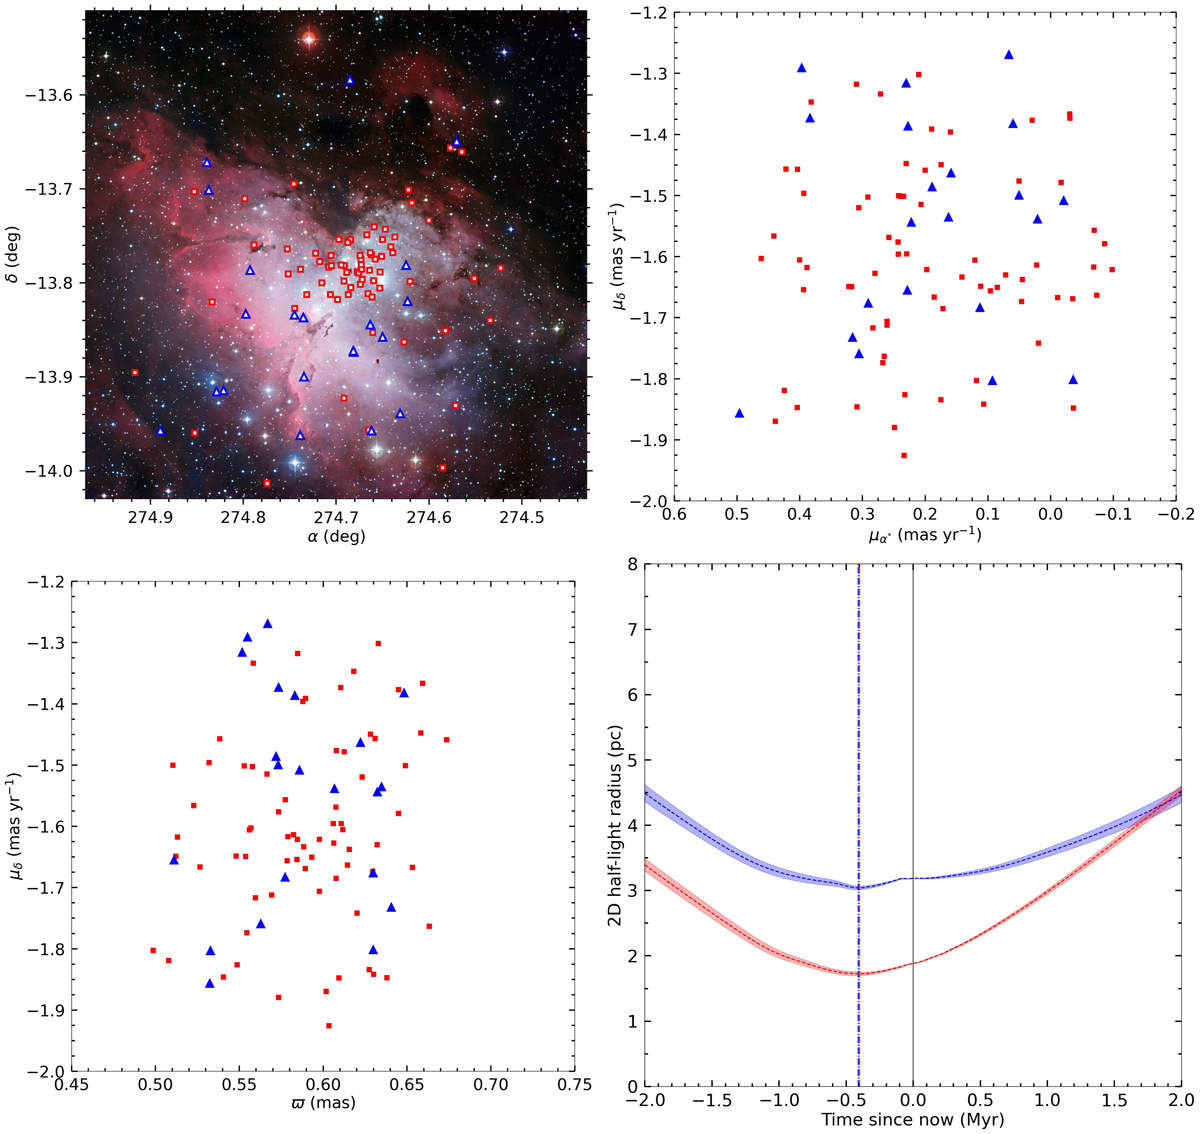
Distribution of the young and old population (the red and blue group, respectively), coloured and marked similarly as in Fig. 4. Top-left: B, V and R composite mosaic image of NGC 6611 (ESO, press release 0926) showing the spatial distribution. Top-right: proper motion distribution. Bottom-left: parallax distribution. Bottom-right: 2D half-light radius for each population as a function of time. The dashed line indicates the mean radius and the coloured region indicates 1σ uncertainty. The dash dotted lines give the time of minimum radius for each population. The young population shows a minimum –0.40 Myr ago, while the old population shows a minimum –0.41 Myr ago.
Current usage metrics show cumulative count of Article Views (full-text article views including HTML views, PDF and ePub downloads, according to the available data) and Abstracts Views on Vision4Press platform.
Data correspond to usage on the plateform after 2015. The current usage metrics is available 48-96 hours after online publication and is updated daily on week days.
Initial download of the metrics may take a while.