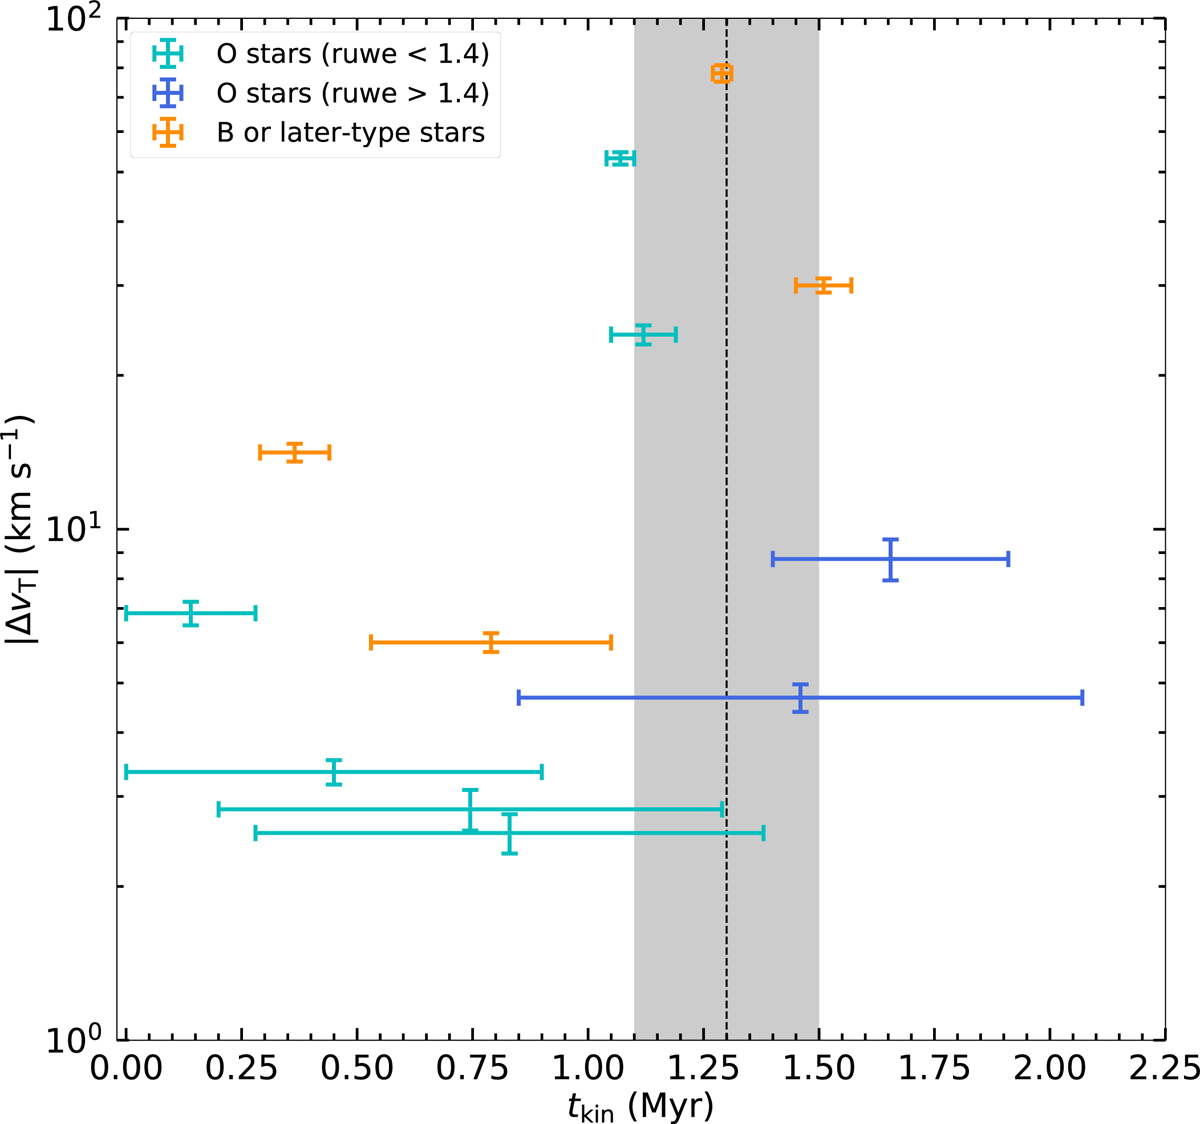
Fig. 10.
Download original image
Relative transverse velocity as a function of the determined range in kinematic age. We show the best-fit age and uncertainty determined with isochrone fitting with the black dashed line and shaded region respectively. The runaway O stars are shown in blue and cyan, while the runaway B or later-type stars are shown in orange. The O stars are coloured similarly as in Fig. 9.
Current usage metrics show cumulative count of Article Views (full-text article views including HTML views, PDF and ePub downloads, according to the available data) and Abstracts Views on Vision4Press platform.
Data correspond to usage on the plateform after 2015. The current usage metrics is available 48-96 hours after online publication and is updated daily on week days.
Initial download of the metrics may take a while.