Open Access
Fig. 7
Download original image
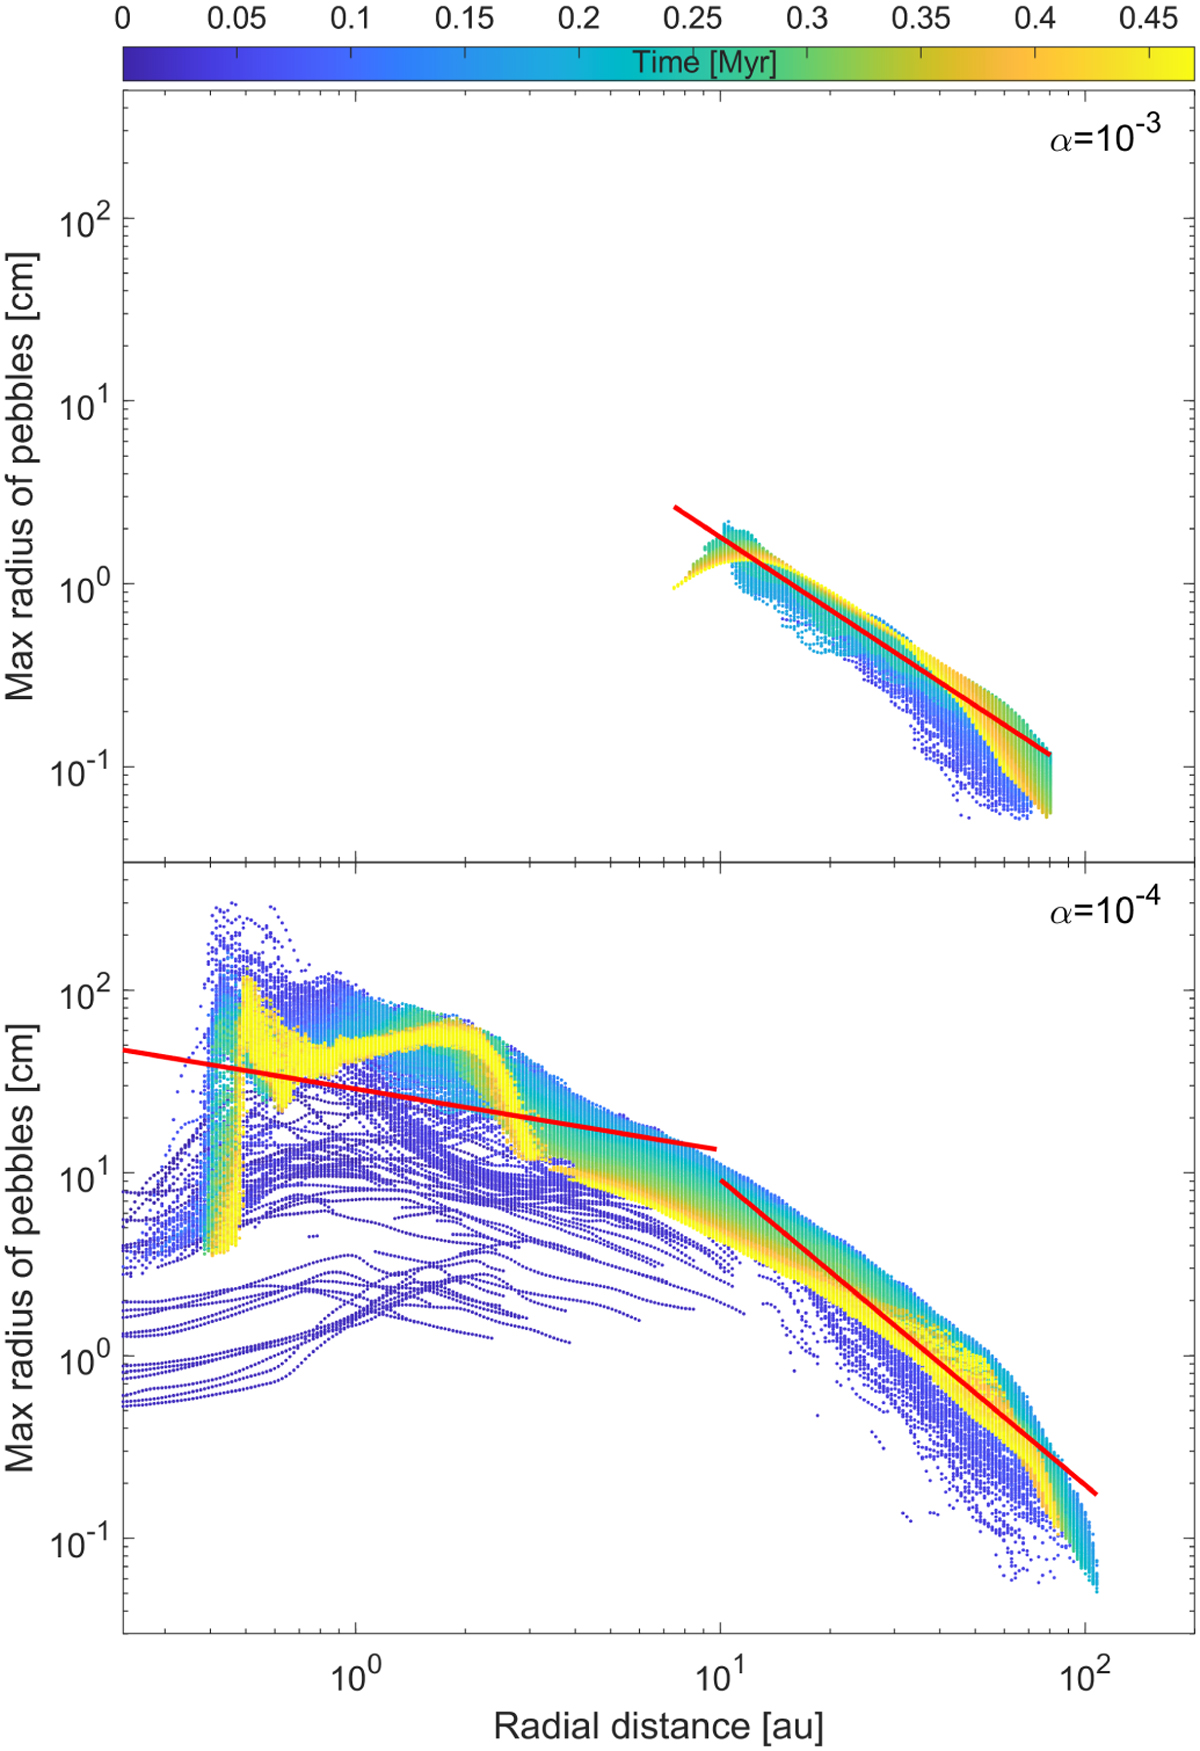
Radial distribution of azimuthally averaged maximum pebble size in the α = 10−3 (top panel) and α = 10−4 (bottom panel) models. The age of the system is shown with the color bar. The red lines show the power-law fitting to the model data.
Current usage metrics show cumulative count of Article Views (full-text article views including HTML views, PDF and ePub downloads, according to the available data) and Abstracts Views on Vision4Press platform.
Data correspond to usage on the plateform after 2015. The current usage metrics is available 48-96 hours after online publication and is updated daily on week days.
Initial download of the metrics may take a while.