Fig. C.1
Download original image
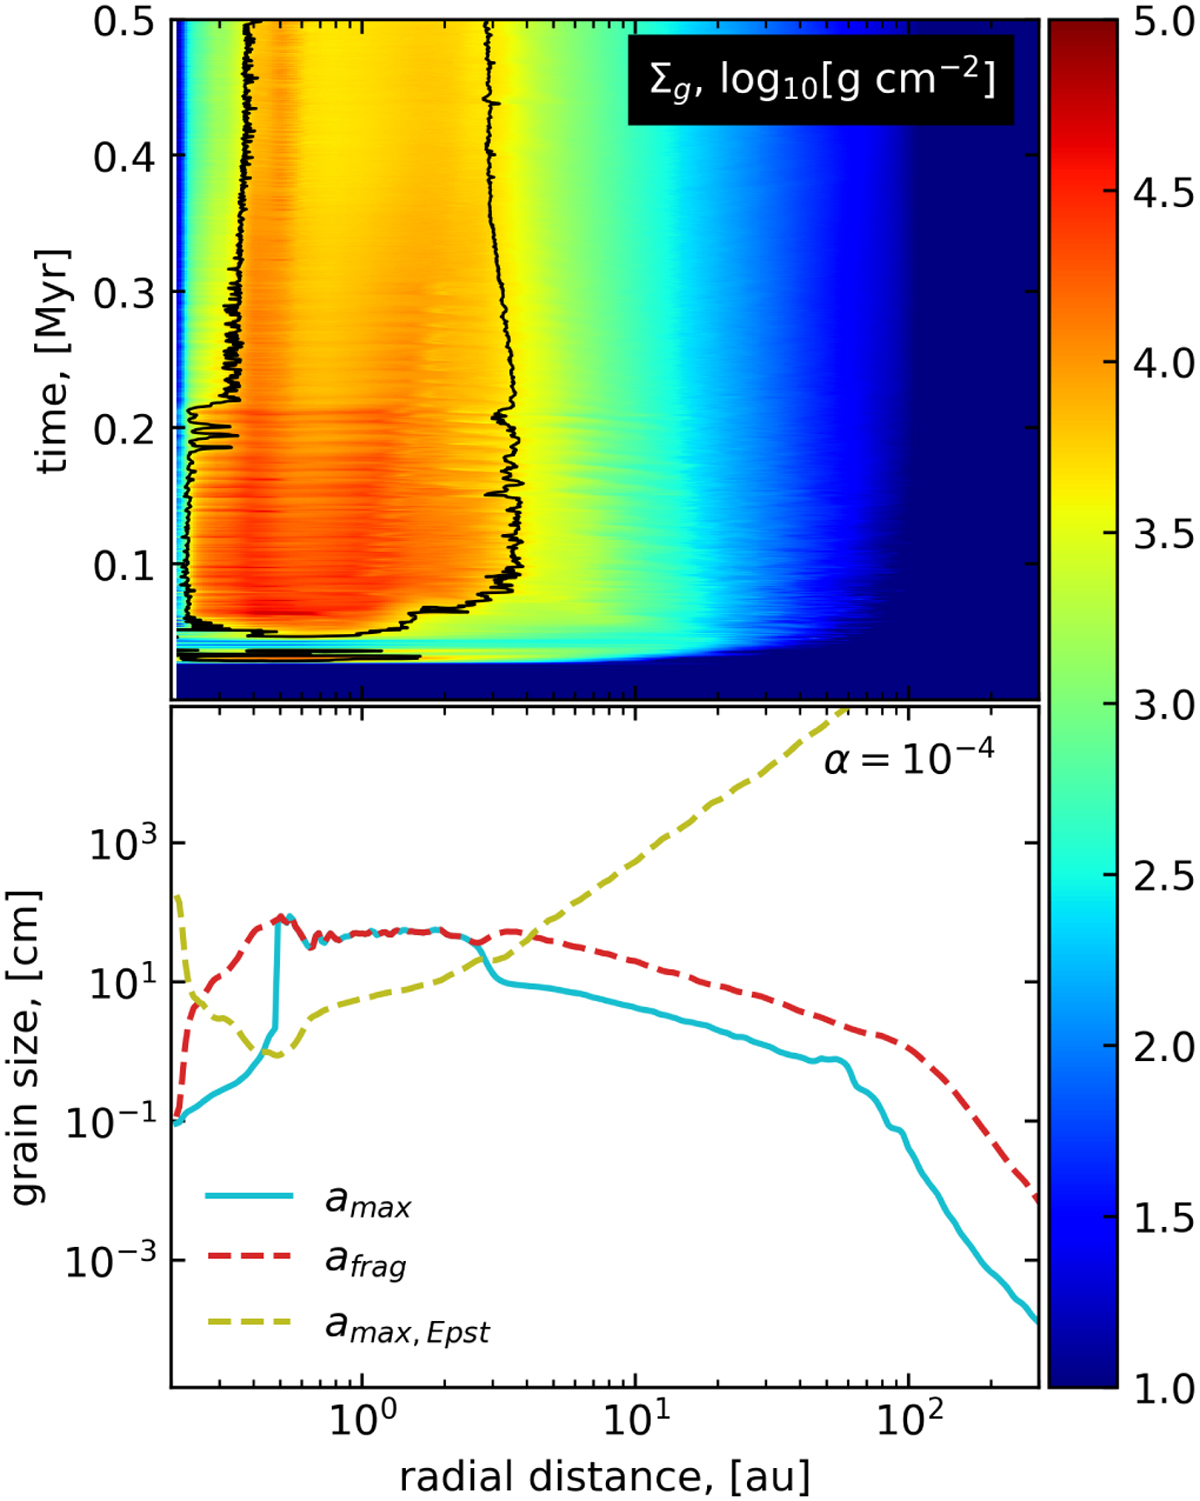
Top panel: Temporal evolution of the azimuthally averaged gas surface density in the α = 10−4 model, with the Stokes drag region outlined by the black curves. Bottom panel: Radial profiles of maximal dust size (cyan line), fragmentation barrier (dashed red line), and maximum size of grown dust up to which dust dynamics can be described by the Epstein drag (dashed yellow line). The profiles are shown at a time instance of t = 500 kyr after the onset of simulations.
Current usage metrics show cumulative count of Article Views (full-text article views including HTML views, PDF and ePub downloads, according to the available data) and Abstracts Views on Vision4Press platform.
Data correspond to usage on the plateform after 2015. The current usage metrics is available 48-96 hours after online publication and is updated daily on week days.
Initial download of the metrics may take a while.