Fig. 7.
Download original image
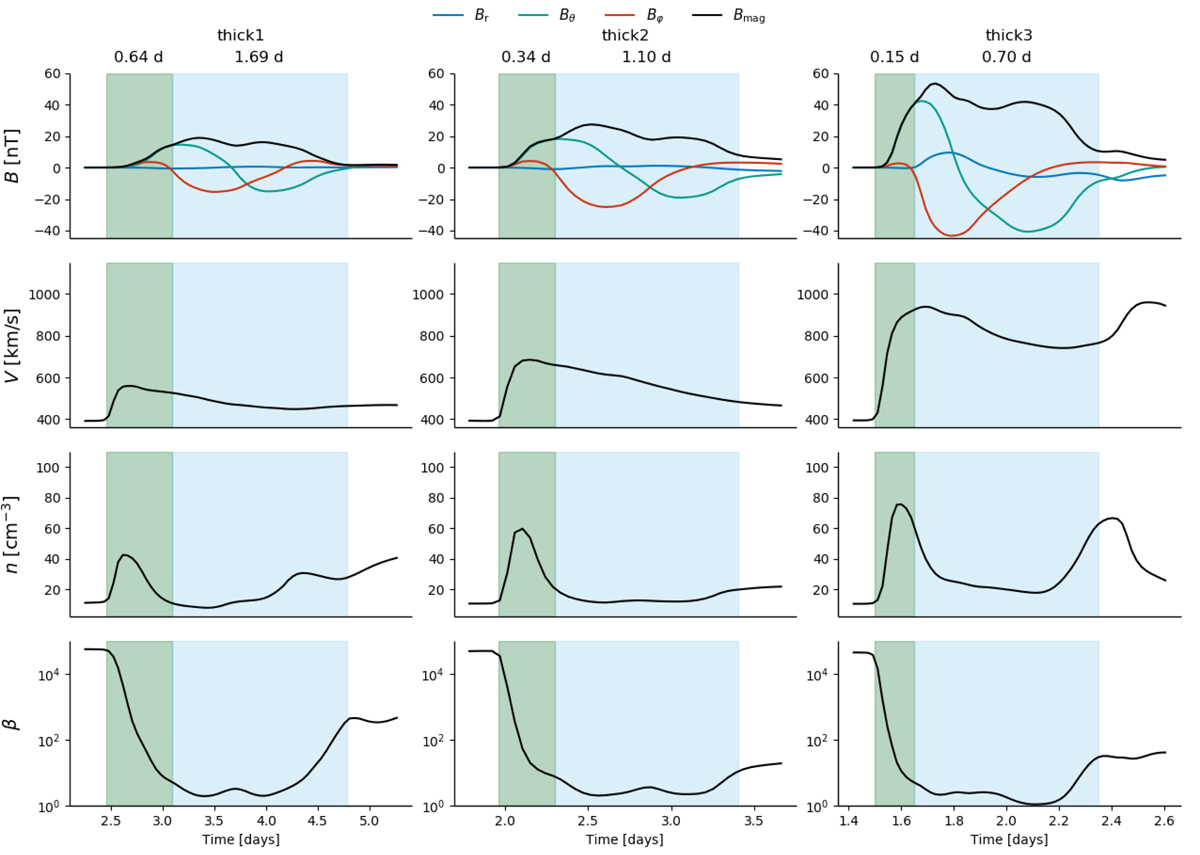
Synthetic crossings at 1 au of the three thick flux ropes. Shown are (from the top to bottom) the magnetic field and its components (see legend for the color-coding) in nT, the speed in km s−1, the density in cm−3, and the β parameter as a function of time. The green and the blue areas correspond respectively to the sheath and the ME.
Current usage metrics show cumulative count of Article Views (full-text article views including HTML views, PDF and ePub downloads, according to the available data) and Abstracts Views on Vision4Press platform.
Data correspond to usage on the plateform after 2015. The current usage metrics is available 48-96 hours after online publication and is updated daily on week days.
Initial download of the metrics may take a while.