Fig. 6.
Download original image
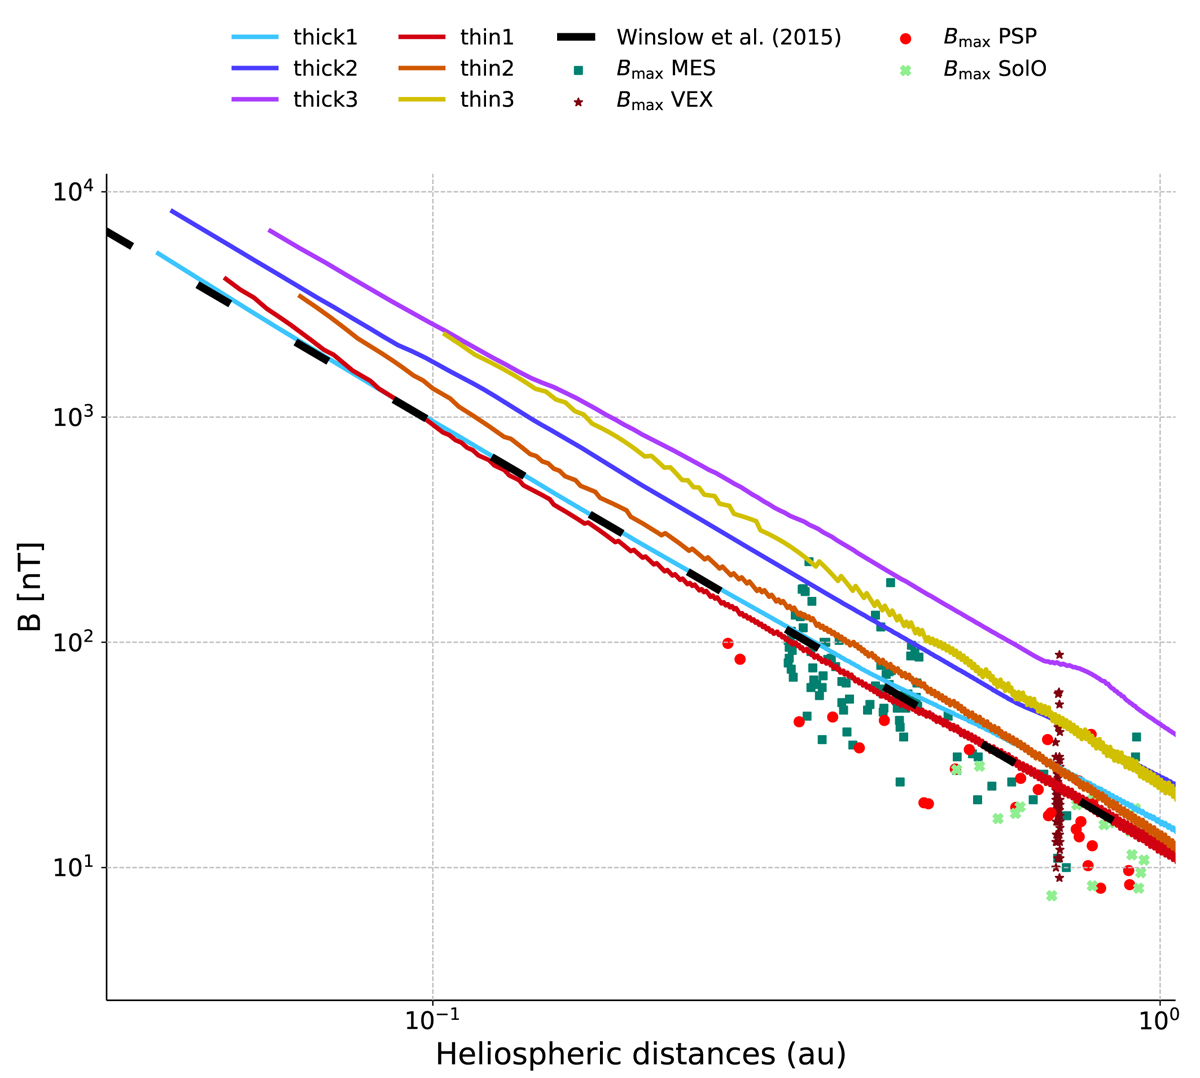
Evolution of the magnetic field (in nT) at the position determined by the Gaussian fitting of the ME as a function of the distance from the Sun (in au). The solid colored lines correspond to the simulated flux ropes. The black dashed line corresponds to a power law deduced from the observations in Winslow et al. (2015). Finally, the maximum magnetic field measured during an ICME encounter at Messenger (MES), Venus Express (VEX), Parker Solar Probe (PSP) and Solar Orbiter (SolO) (Winslow et al. 2015; Good & Forsyth 2016; Möstl et al. 2017, 2020) are also shown in this plot.
Current usage metrics show cumulative count of Article Views (full-text article views including HTML views, PDF and ePub downloads, according to the available data) and Abstracts Views on Vision4Press platform.
Data correspond to usage on the plateform after 2015. The current usage metrics is available 48-96 hours after online publication and is updated daily on week days.
Initial download of the metrics may take a while.