Open Access
Fig. 4.
Download original image
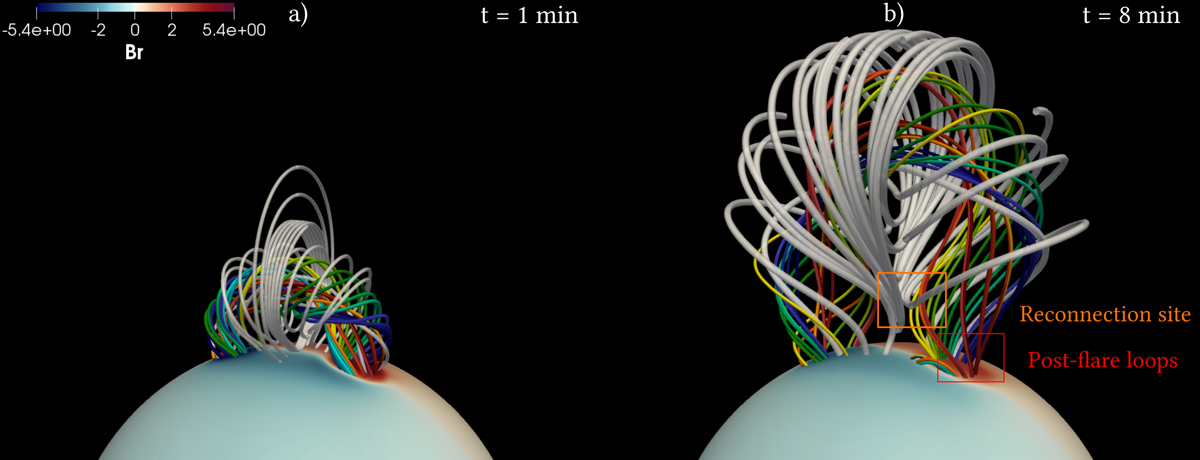
Visualization of the eruption of the thick2 flux rope. The spherical slice and the streamline colors are the same as in Fig. 3. Here the white streamlines start from the ![]() , φ = π line along the radial direction. Panel a) shows the flux rope 1 min after (physical time) its eruption and panel b) 8 min after.
, φ = π line along the radial direction. Panel a) shows the flux rope 1 min after (physical time) its eruption and panel b) 8 min after.
Current usage metrics show cumulative count of Article Views (full-text article views including HTML views, PDF and ePub downloads, according to the available data) and Abstracts Views on Vision4Press platform.
Data correspond to usage on the plateform after 2015. The current usage metrics is available 48-96 hours after online publication and is updated daily on week days.
Initial download of the metrics may take a while.