Fig. 2.
Download original image
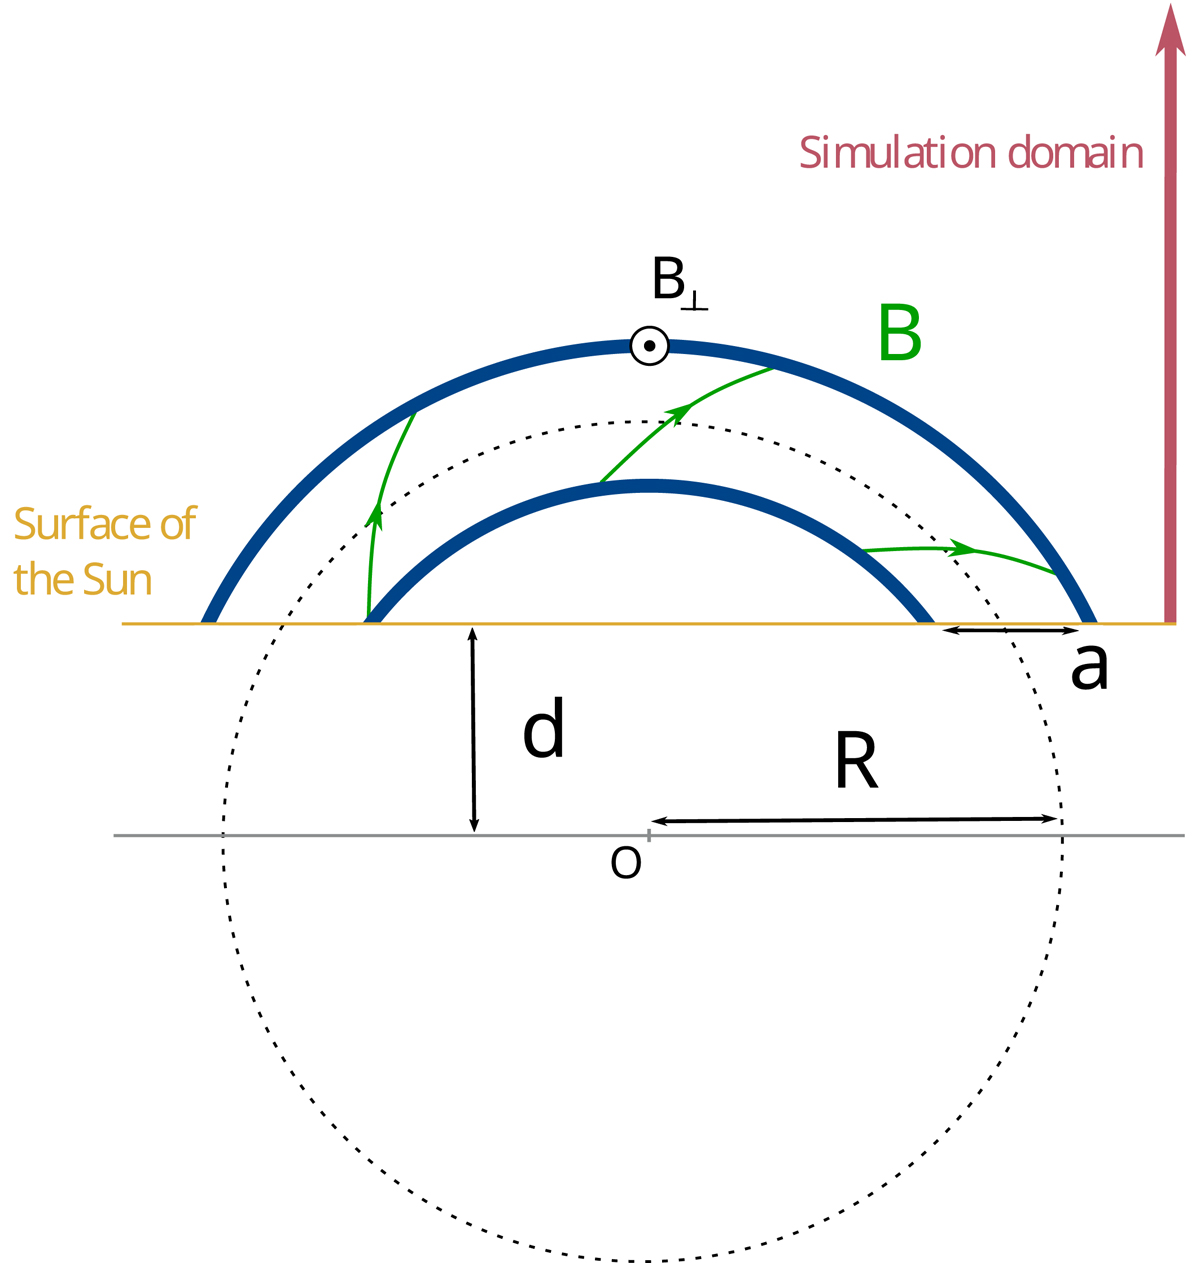
Two-dimensional schematic of the TDm setup. The yellow line corresponds to the inner boundary of the simulation domain and the blue line corresponds to the edge of the flux rope of minor radius a and major radius R. The d parameter controls how much the flux rope is buried in the solar surface (Titov et al. 2014). The magnetic field of the twisted flux rope appears in green. B⊥ correspond to the ambient magnetic field.
Current usage metrics show cumulative count of Article Views (full-text article views including HTML views, PDF and ePub downloads, according to the available data) and Abstracts Views on Vision4Press platform.
Data correspond to usage on the plateform after 2015. The current usage metrics is available 48-96 hours after online publication and is updated daily on week days.
Initial download of the metrics may take a while.