Fig. 4.
Download original image
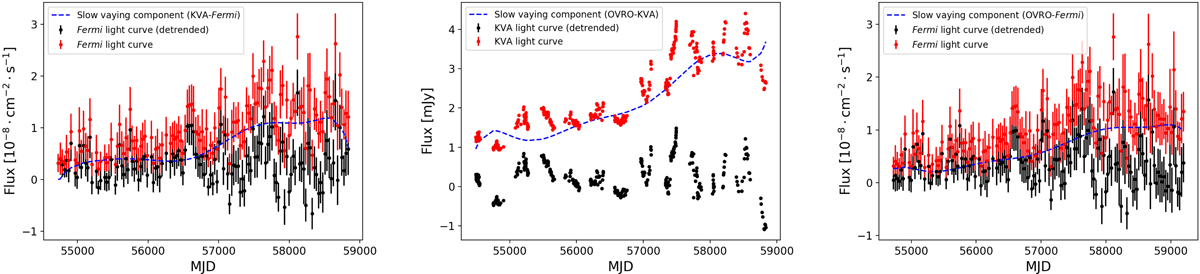
Light curve detrending results. Blue dashed lines represent the scaled low-frequency light curve best fit, red dots correspond to the original data set and black dots show the detrended light curve. Left: Fermi-LAT light curve after optical trend subtraction. Middle: optical light curve after radio trend subtraction. Right: Fermi-LAT light curve after radio trend subtraction.
Current usage metrics show cumulative count of Article Views (full-text article views including HTML views, PDF and ePub downloads, according to the available data) and Abstracts Views on Vision4Press platform.
Data correspond to usage on the plateform after 2015. The current usage metrics is available 48-96 hours after online publication and is updated daily on week days.
Initial download of the metrics may take a while.