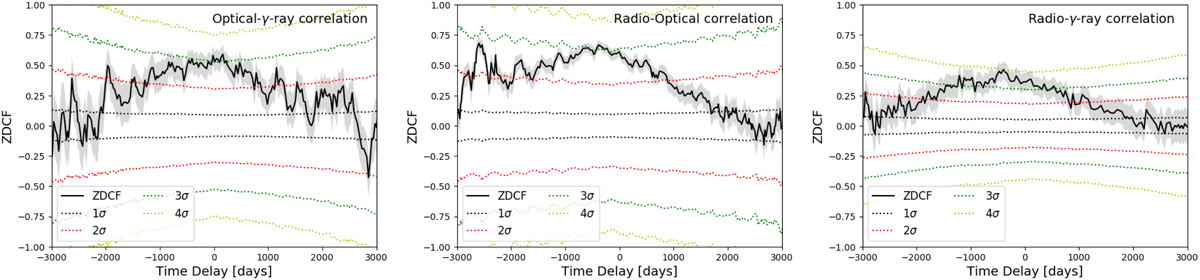
Fig. 3.
Download original image
Long-term cross-correlation curves. The ZDCF is represented in black and its 1σ uncertainty by the grey contour. Coloured dotted lines correspond to different significance levels, from 1σ to 4σ. Left: cross-correlation between the optical and HE γ-ray light curves. Middle: cross-correlation between the radio and optical light curves. Right: cross-correlation between the radio and HE γ-ray light curves.
Current usage metrics show cumulative count of Article Views (full-text article views including HTML views, PDF and ePub downloads, according to the available data) and Abstracts Views on Vision4Press platform.
Data correspond to usage on the plateform after 2015. The current usage metrics is available 48-96 hours after online publication and is updated daily on week days.
Initial download of the metrics may take a while.