Fig. 5.
Download original image
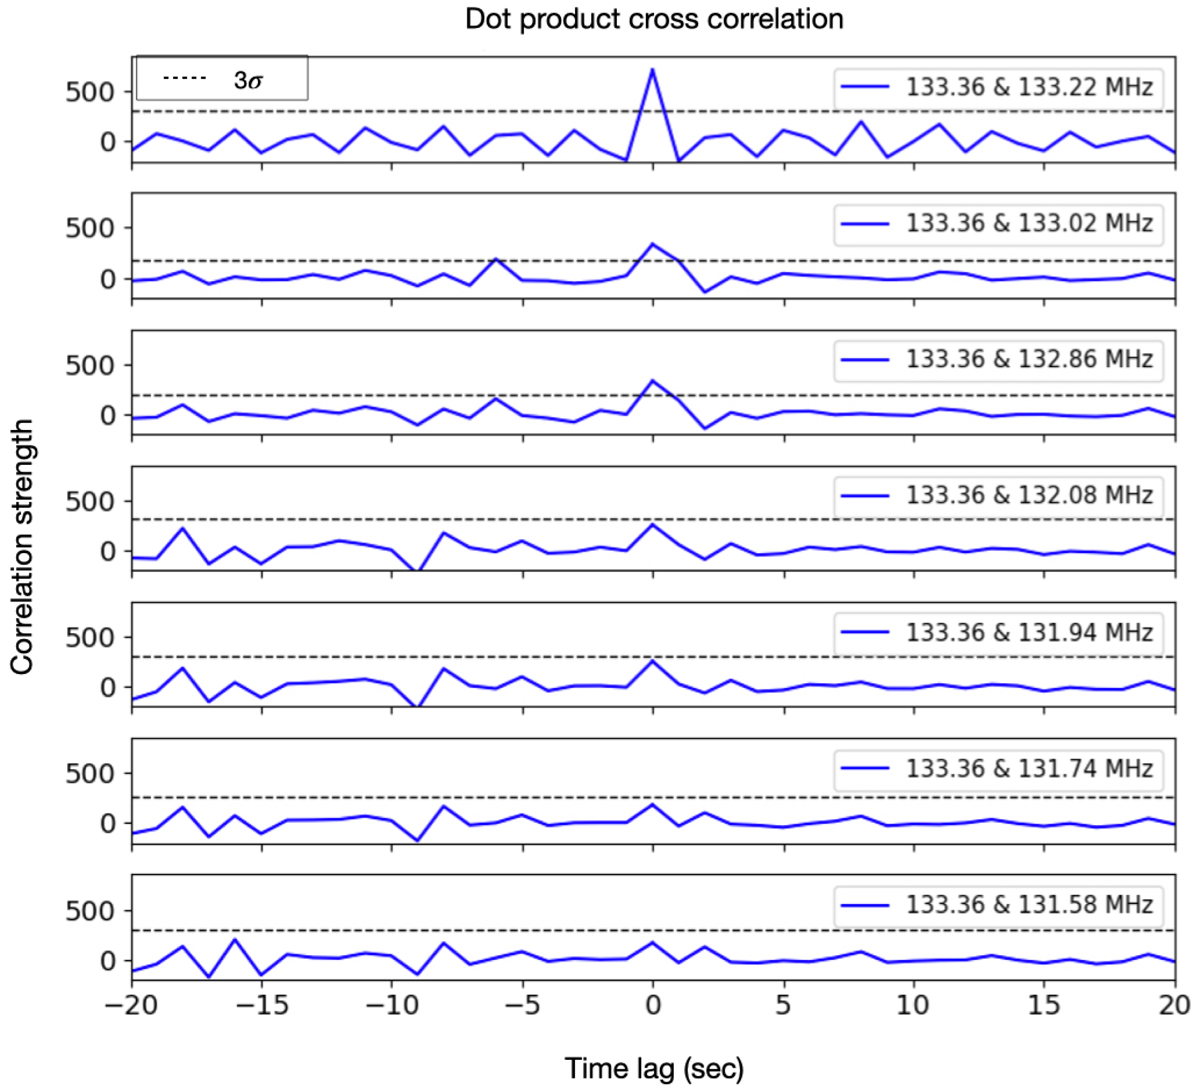
Dot product correlation (blue) of the magnitude and Δθ between 133.36 MHz and seven other frequencies (133.22, 133.02, 132.86, 132.08, 131.94, 131.74, and 131.58 MHz). Dot product correlation represents a cross correlation of instantaneous direction and amplitude changes for sources in adjacent frequency channels. The dashed line represents the 3σ above the background noise for each of the correlation plots. We regard the correlation to be significant only if it exceeds 3σ. Clearly, there exists a significant correlation between the top three frequency pairs at zero time lag, which drops below 3σ level with increasing separation between frequencies.
Current usage metrics show cumulative count of Article Views (full-text article views including HTML views, PDF and ePub downloads, according to the available data) and Abstracts Views on Vision4Press platform.
Data correspond to usage on the plateform after 2015. The current usage metrics is available 48-96 hours after online publication and is updated daily on week days.
Initial download of the metrics may take a while.