Fig. 4.
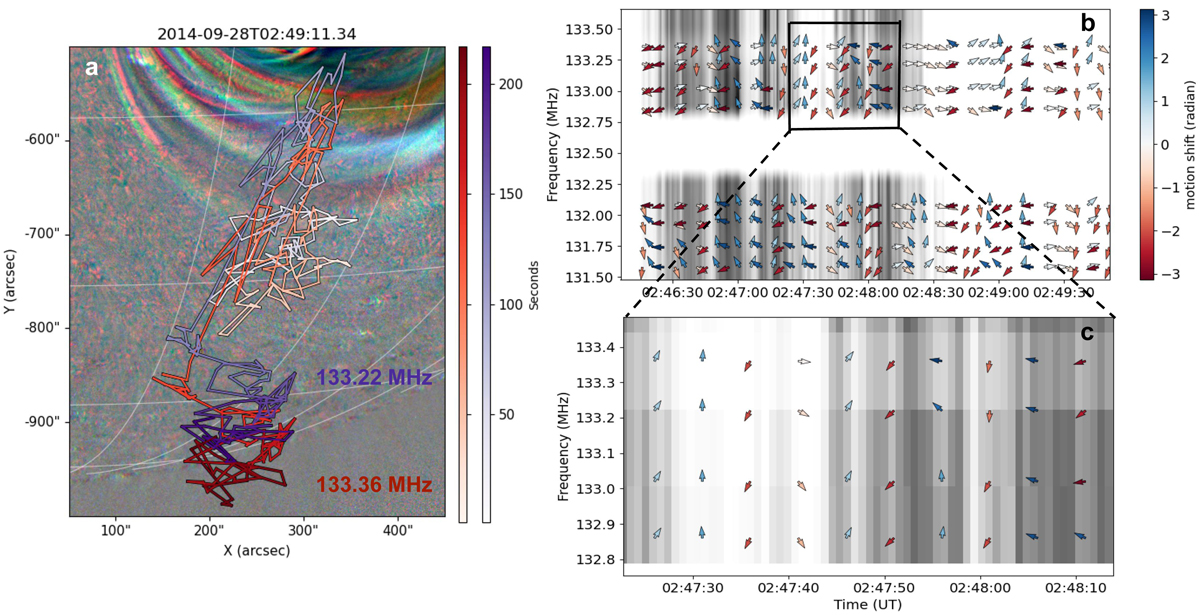
Download original image
Fine-scale motion of the radio sources. (a) The running ratio image of the eruption in AIA 193, 211, and 171 Å channels at 02:49:11 UT. The positions of the type II sources of 133.36 MHz (red) and 133.22 (purple) MHz are plotted over the image for a duration of 5 min, represented by red and purple bars, respectively. The dynamic spectra in panels b and c on the right show the peak amplitude of the Gaussian-fitted source. The arrows represent the instantaneous change in direction (θi + 1 − θi) of the source motion for different frequencies (131.58, 131.74, 131.94, 132.08, 132.86, 133.02, 133.22 and 133.36 MHz) in the channel. The blue arrows represent when the change in angle lies between 0 and π radians. Similarly, the red arrows represent when the change in direction lies between 0 and −π radians. Panel c shows a zoomed-in view of the region marked in panel b. In panel c, one can see that, at each time point, the arrows point in almost the same direction across nearby frequency channels, exhibiting the correlated fine-scale motion.
Current usage metrics show cumulative count of Article Views (full-text article views including HTML views, PDF and ePub downloads, according to the available data) and Abstracts Views on Vision4Press platform.
Data correspond to usage on the plateform after 2015. The current usage metrics is available 48-96 hours after online publication and is updated daily on week days.
Initial download of the metrics may take a while.