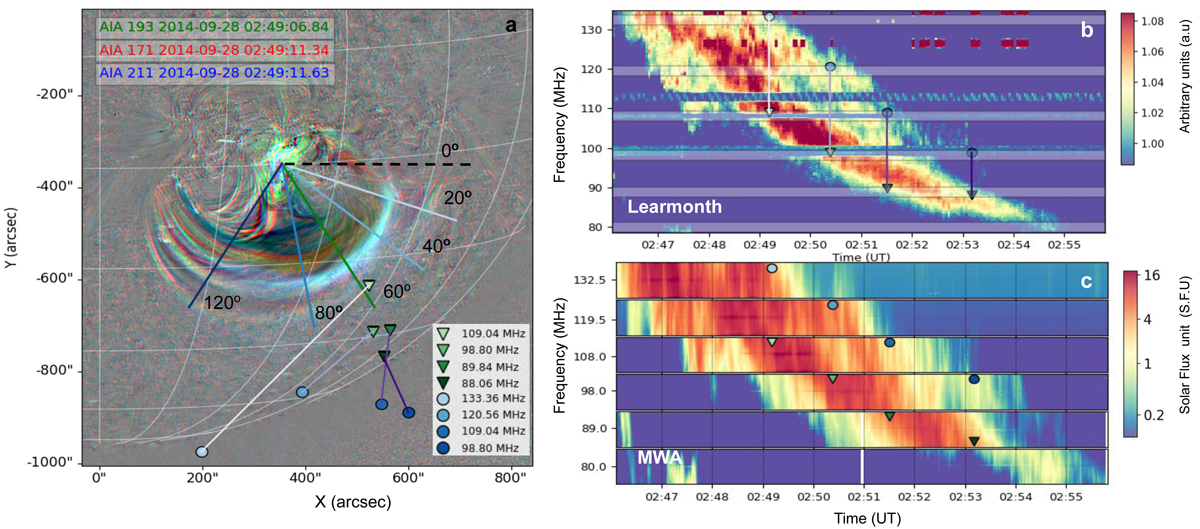
Fig. 2.
Download original image
Analysis of the band-split radio sources. (a) The ratio image of the eruptive event with SDO/AIA in 171, 193, 211 Å channels at 02:49:11 UT. The blue circle and green triangle points on the image are the position of radio sources of different frequencies at the same time from HFS and LFS, respectively (shown in panel b). The lines connect the HFS and LFS points at the same time. It is clear that both band sources are moving in different directions from each other and they are well separated in position. The top (b) and bottom (c) plots of the right panel show the Learmonth and MWA dynamic spectra of the type II harmonic band, respectively. The rectangular panels on the Learmonth spectra highlight the regions of the type II observed by MWA.
Current usage metrics show cumulative count of Article Views (full-text article views including HTML views, PDF and ePub downloads, according to the available data) and Abstracts Views on Vision4Press platform.
Data correspond to usage on the plateform after 2015. The current usage metrics is available 48-96 hours after online publication and is updated daily on week days.
Initial download of the metrics may take a while.