Fig. 1.
Download original image
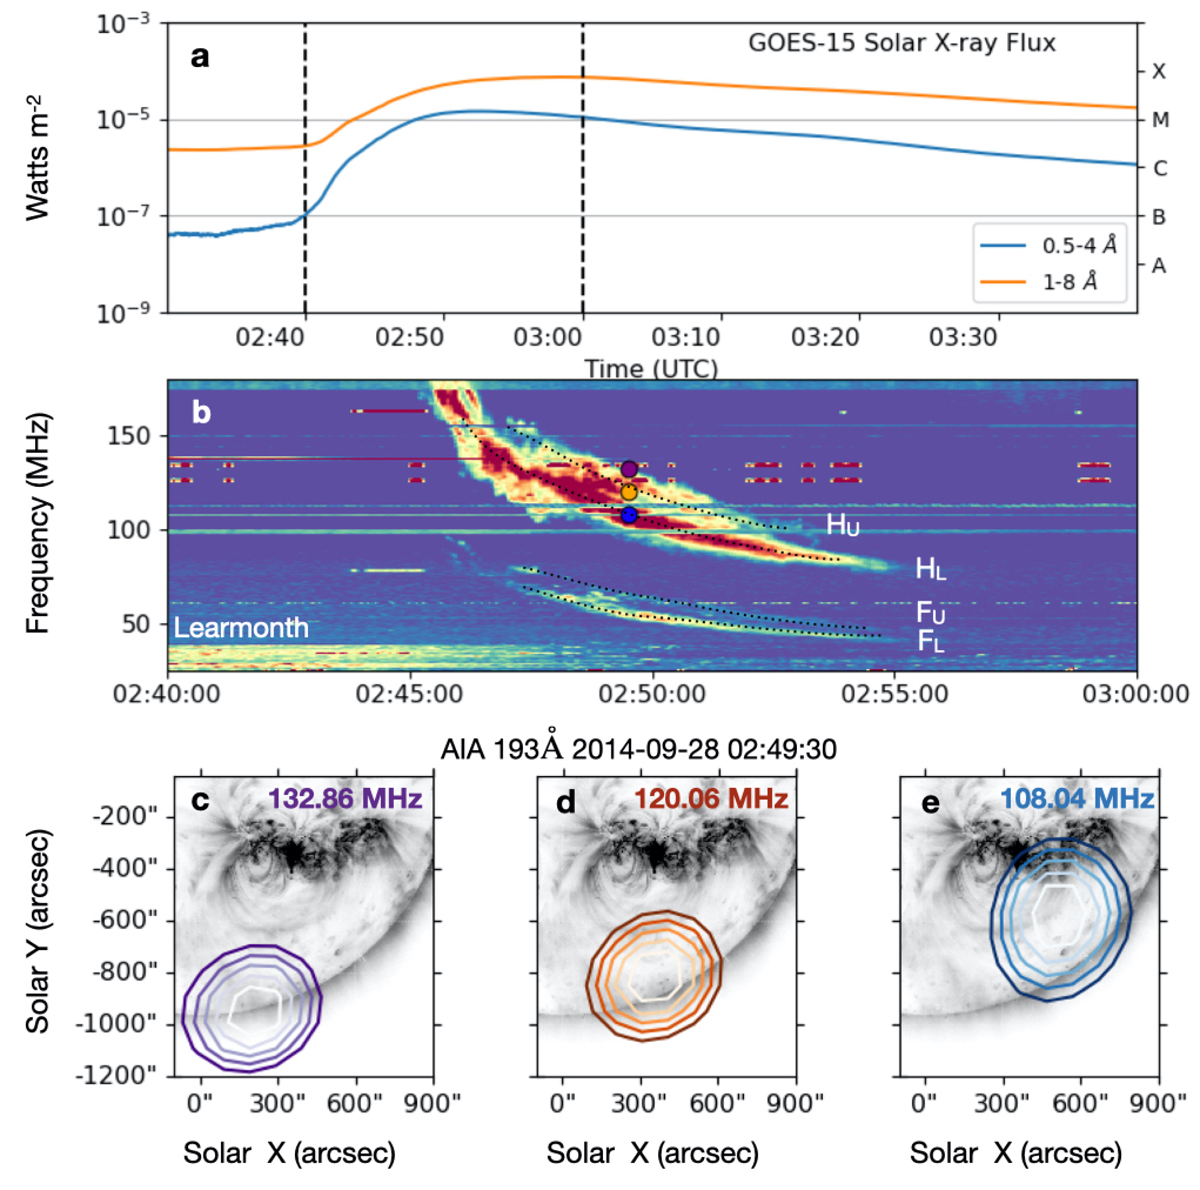
Overview of the event observed by GOES-15, Learmonth, AIA and MWA. (a) GOES-15 light curves indicating a M5.1 class flare. The two vertical dashed lines show the time range of the Learmonth dynamic spectra. (b) Dynamic spectra of the type II radio burst observed by the Learmonth spectrograph. It is clear that the fundamental band shows band-spitting where the high- and low-frequency branches are indicated by FU and FL, respectively. The corresponding band splitting in the harmonic band is marked by HU and HL, respectively. (c)–(e) The three images show the position of MWA radio contours overlaid on the AIA 193 Å channel base image at 02:49:30 UT. The purple, orange, and blue contours are the MWA 132.86, 120.06, and 108.54 MHz contours (50%, 60%, 70%, 80%, and 90% of the peak intensity), respectively. These show the positions of the radio sources of different frequencies at the same time, indicated by purple, orange, and blue points on the Learmonth spectra.
Current usage metrics show cumulative count of Article Views (full-text article views including HTML views, PDF and ePub downloads, according to the available data) and Abstracts Views on Vision4Press platform.
Data correspond to usage on the plateform after 2015. The current usage metrics is available 48-96 hours after online publication and is updated daily on week days.
Initial download of the metrics may take a while.